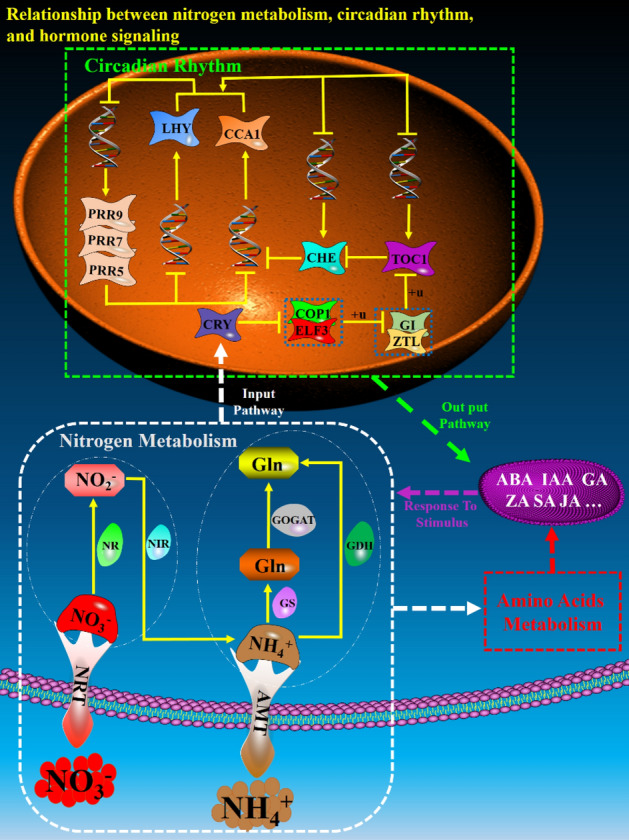
Figure 6.

Hypothetical model showing the mutual regulation of nitrogen metabolism, circadian rhythms, and hormone signal transduction. The combination of two rows of purple balls with yellow connections between them represents the cell membrane, and the orange ellipse represents the cell nucleus. Dashed arrows, solid arrows, and T-shaped segments represent possible input and output pathways, activation, and inhibition, respectively. The thin white dotted line is used to distinguish NO3- reduction and NH4+ assimilation in nitrogen metabolism, while the blue dotted boxes in the circadian rhythm pathway represent protein complexes. The white, green, and red thick dotted boxes and the purple ellipse represent nitrogen metabolism, circadian rhythms, amino acid metabolism, and hormone signal transduction pathways, respectively. From bottom to top, the cluster of red and brown balls represents NO3- and NH4+ outside the cell, respectively; the ‘tree’-shaped molecules represent the transmembrane transporters NRT and AMT; the ‘caps’ on the transmembrane proteins represent NO3- and NH4+ transported into the cell; hexagons with different colours represent various products of nitrogen metabolism; in the nitrogen metabolism pathway, irregular shapes with different colours attached to each line represent different enzymes of nitrogen metabolism; in the circadian rhythm pathway, irregular shapes with different colours represent different proteins; the double helix structure represents DNA; and the ‘ + u’ around the solid line represents ubiquitination.
