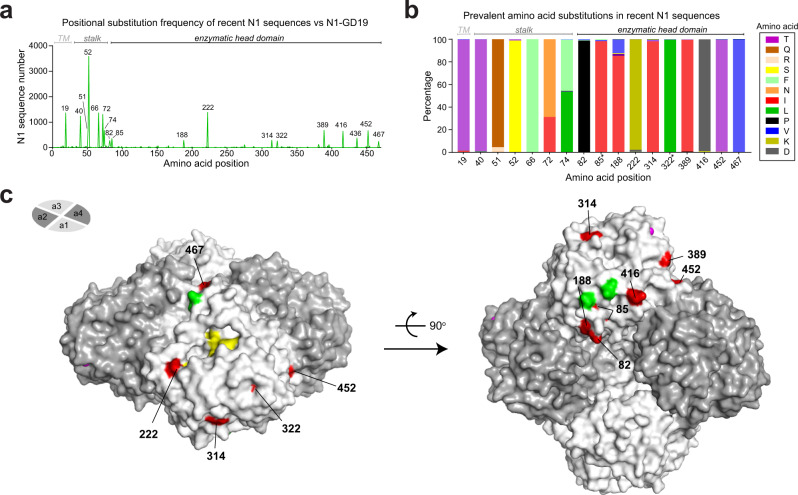
Fig. 4. Comparison of NAs from recent H1N1 viruses and the 2020–2021 vaccine strain.
a Amino acid positional analysis displaying the number of recent N1 sequences that encode different amino acids from N1-GD19 at each position. N1 sequences were from human H1N1 IAVs collected between September 1, 2019 and December 15, 2020. Regions corresponding to the transmembrane (TM) domain, stalk and enzymatic head domain are indicated. b Bar graph displaying the prevalence of the amino acids in the recent N1 sequences that differ from N1-GD19 at each position. Only amino acids visible in the graph are listed in the legend. Asterisk indicates amino acids with little surface exposure. c Amino acid positions that differ in the recent N1 sequences are highlighted (red) on a single monomer of a head domain tetramer (PDB ID: 3NSS)54 along with the Asn residues (green) of the conserved N-linked glycosylation sites48, NA active site residues (yellow), and Ca2+ ions (pink). Side (left) and bottom (right) views of the NA tetramer were generated using Pymol.

