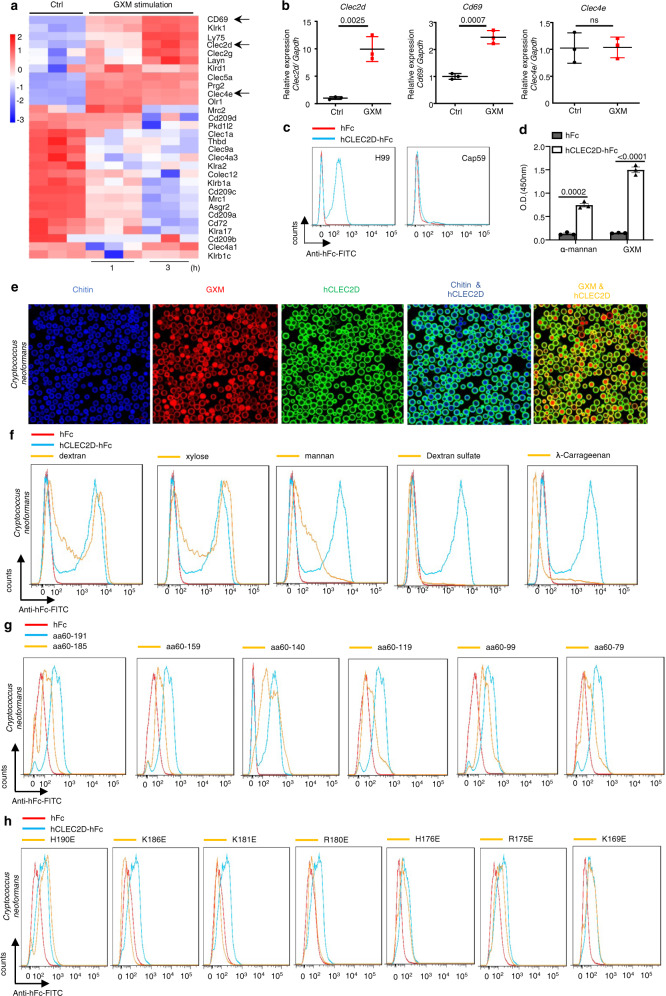
Fig. 3. CLEC2D specifically recognizes GXM from C. neoformans.
a Microarray analysis of differentially expressed genes encoding C-type lectin receptors in BM-derived MDSCs generated by GM-CSF (40 ng/ml) + GXM (10 μg/well), which were then treated with PBS (Ctrl) or GXM (10 μg/well) for the indicated time. b Quantitative analysis of Cd69, Clec2d, and Clec4e expression in BM-derived MDSCs prepared as shown in a. c Binding assay of the soluble protein chimera hCLEC2D-hIgG1-Fc or hIgG1-Fc (hFc) to C. neoformans using flow cytometry. d ELISA assay of the binding of hCLEC2D-hIgG1-Fc or hIgG1-Fc (hFc) with plate-coated GXM or α-mannan (1 μg/well). e Representative immunofluorescent staining assay of the binding of C. neoformans with hCLEC2D-hIgG1-Fc (anti-hIgG1-Fc as second Ab, green), Calcofluor White (50 μg/ml, Chitin staining, blue) or GXM. Chitin was stained with Calcofluor White (50 μg/ml) (blue), and 18B7 Ab (GXM, red). f Flow cytometry assay of the competitive binding of C. neoformans with CLEC2D-hIgG1-Fc or hIgG1-Fc (hFc) using the indicated polysaccharides. g, h Flow cytometry assay of the binding of C. neoformans with the indicated soluble protein truncations (g) or amino acid mutated proteins (h) of CLEC2D-hIgG1-Fc2. Data were presented as mean ± SEM, n = 3 (b, d) biologically independent samples. Data were analyzed by unpaired two-sided Student’s t-test in b and one-way ANOVA adjusted for multiple comparisons in d. Source data are provided as a Source Data file.

