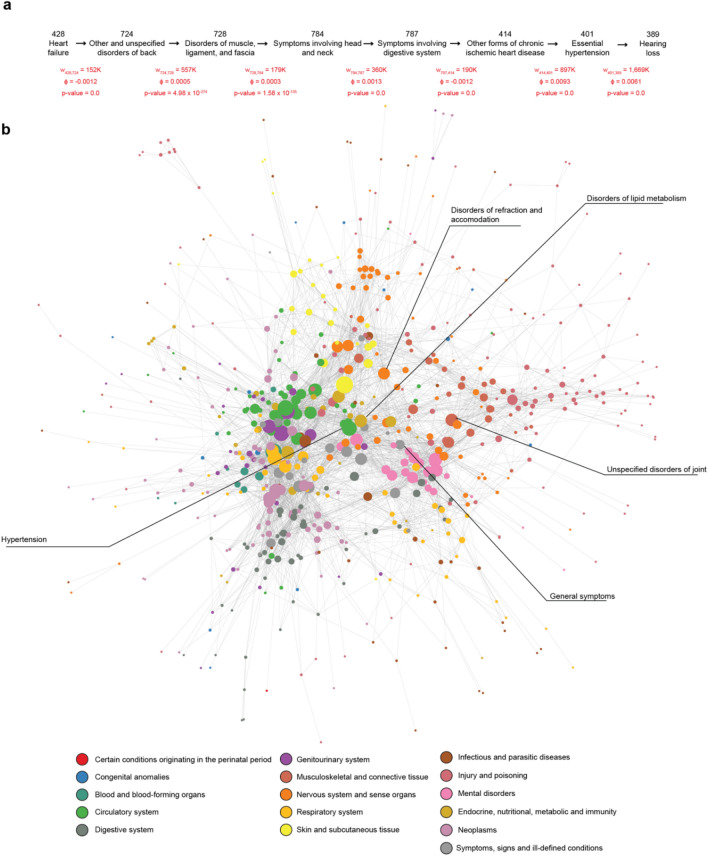
Figure 1.
Temporal Disease Network. (a) Example of the disease records for a single patient and its representation into disease paths. The Disease Network connects diseases that occur consecutively in patients' records. Edge weights wij, p-values, and values are shown for raw data and represent the number of patients, the correlation coefficient, and the significance, respectively, for each progression step. (b) Nodes represent diagnoses (ICD9 at the 3-digit level) and links represent the number of patients with disease A before diseases B. For visualization purposes, the edge directions were merged as single undirected edges, edges with < 0.001 were filtered, and disconnected nodes resulting from this filtering were omitted. The full network contains 718 nodes and 60,425 edges, while the visualization shows 638 nodes and 4,582 edges. The labels highlight diseases mentioned throughout the text and their corresponding nodes in the network.

