
Fig. 2. Homodyne-detected ferromagnetic resonance.
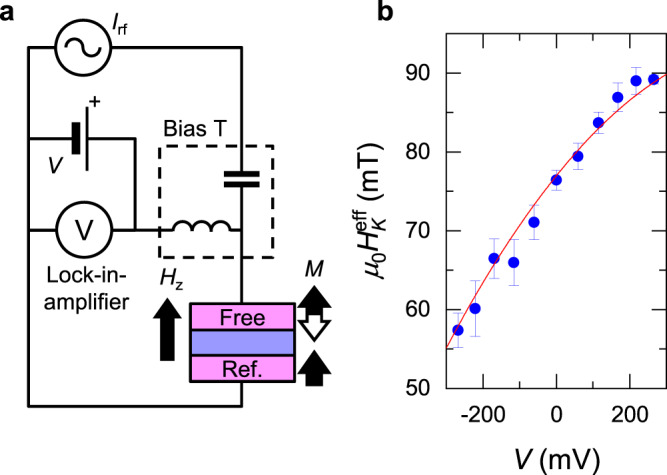
a Electrical circuit for homodyne-detected ferromagnetic resonance (FMR). b DC bias voltage V dependence of effective anisotropy field (μ0HKeff) determined by FMR. Red curves are fitting with a quadratic function to the plots. The error bar shows the standard error of fitting Kittel’s resonant condition to the experimentally obtained resonant frequency versus perpendicular magnetic field Hz.