Figure 1.
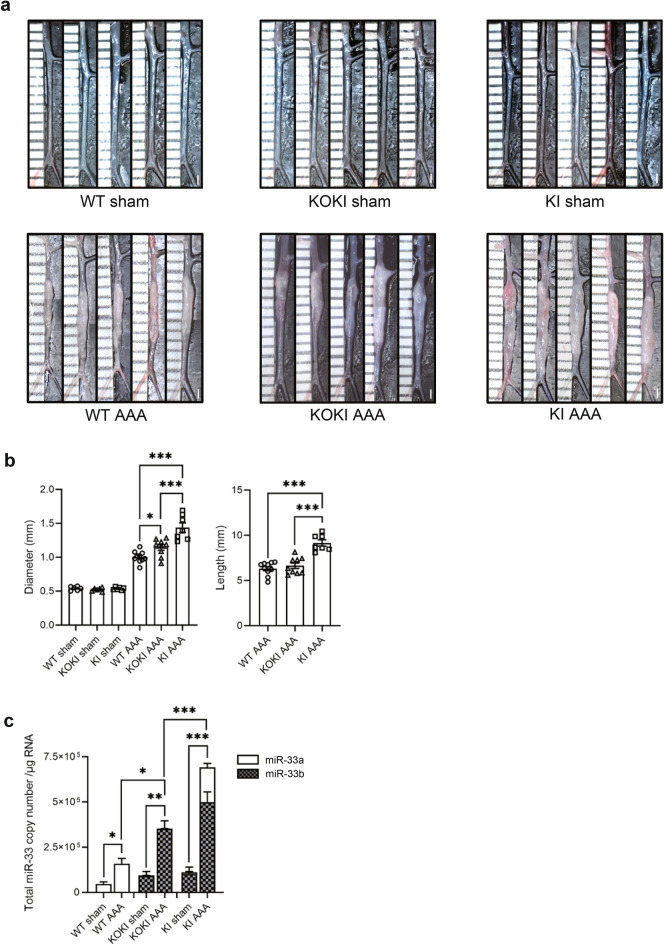
Genetic phenotypes of abdominal aortic aneurysm (AAA) formation in wild-type (WT) mice, miR-33a knock-out and miR-33b knock-in (KOKI) mice, and miR-33b knock-in (KI) mice. (a) Representative photographs of sham controls and calcium chloride (CaCl2)-induced AAA in WT, KOKI, and KI mice. White bars indicate 1 mm. (b) Maximum diameter and lesion length of the abdominal aorta between the left renal artery and the terminal aorta of CaCl2-induced AAA, n = 10 mice in WT, n = 9 mice in KOKI, and n = 7 mice in KI mice. One-way ANOVA with Holm–Sidak’s multiple comparisons test. *P < 0.05 and ***P < 0.001. (c) Absolute copy numbers of miR-33a and miR-33b in sham (left), CaCl2-induced AAA (mid), and integrated graphs, n = 5 mice in each sham, n = 7 mice in WT and KOKI for CaCl2-induced AAA, and n = 7 mice in KI for CaCl2-induced AAA. One-way ANOVA with Holm–Sidak’s multiple comparisons test (left and mid) and two-way ANOVA with Holm–Sidak’s multiple comparisons test (right). *P < 0.05 and **P < 0.01. All data represent mean ± standard error of the mean (SEM).

