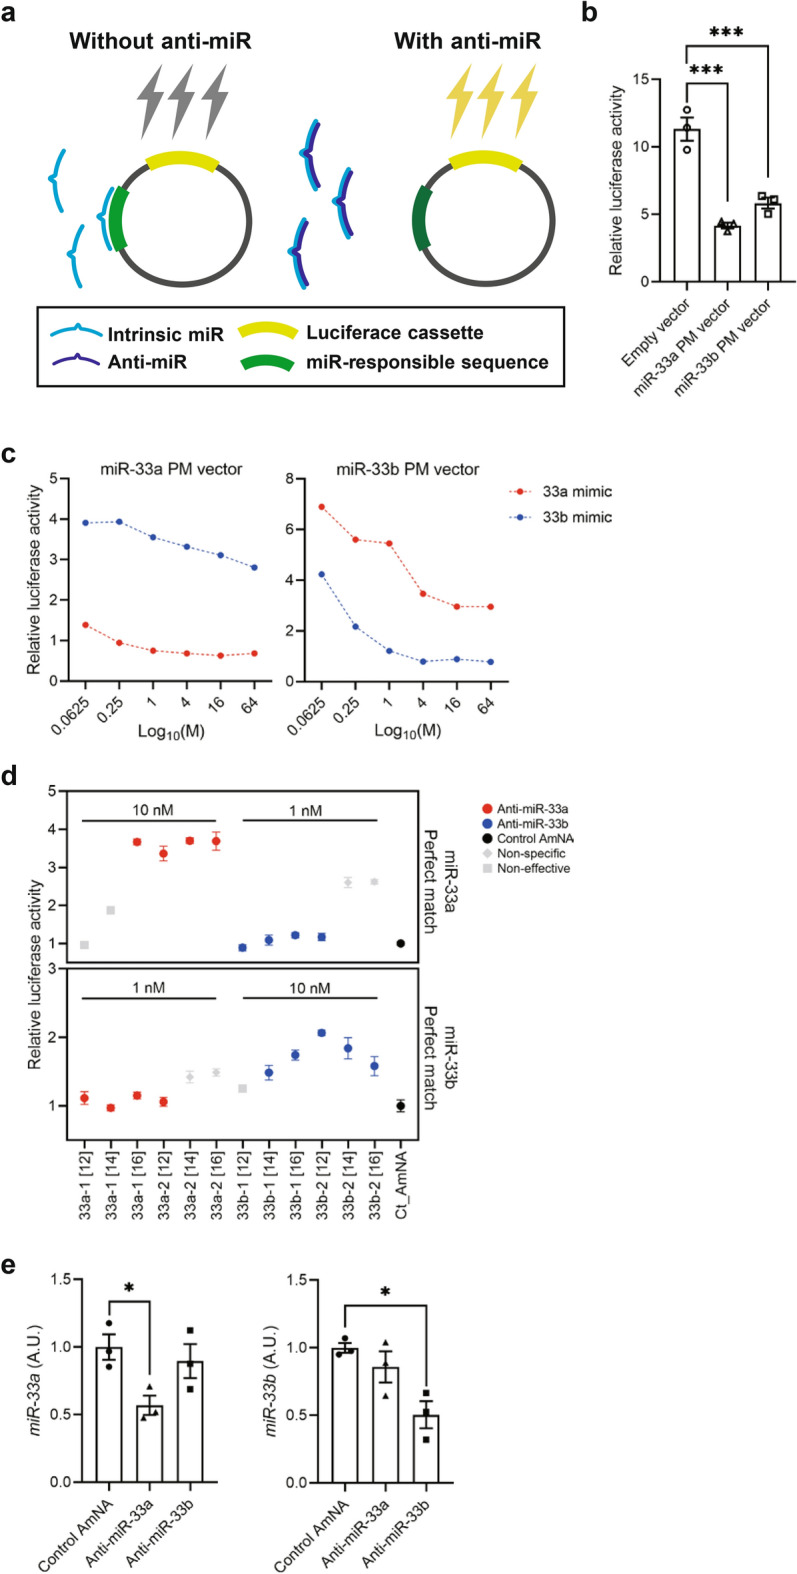
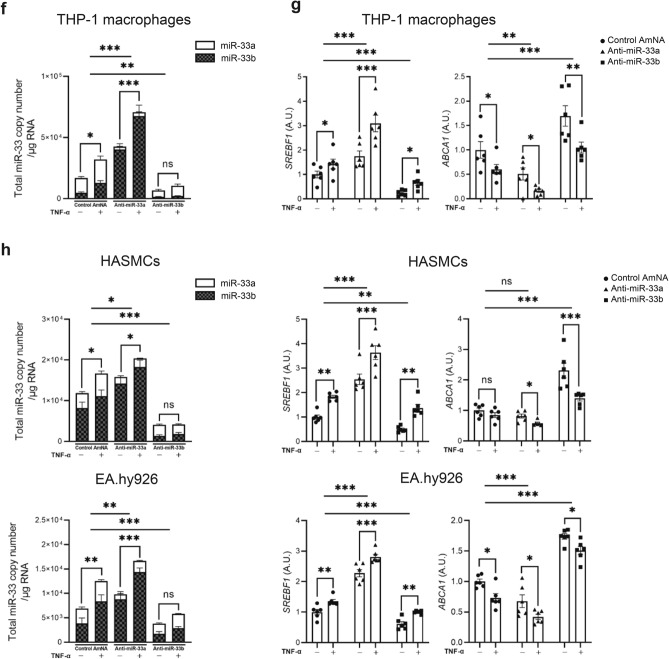
Figure 2.

Selection of effective and specific anti-microRNA oligonucleotide (AMOs) against miR-33a and miR-33b. (a) Experimental scheme for reporter assay. In the absence of anti-microRNA (miR), intrinsic miR inhibits luciferase expression (left). Adding anti-miR inhibits intrinsic miR, and the expression of luciferase will increase. Luciferase intensity is proportional with inhibition efficiency of anti-miRs (right). (b) Reactivities of miR-33a perfect match (33a PM) and miR-33b perfect match (33b PM) reporter vectors in HepG2 cells (human hepatocellular carcinoma cell line), n = 3. One-way analysis of variance (ANOVA) with Dunnett’s multiple comparison test. ***P < 0.001. (c) Evaluation of binding specificity of the reporter vectors to miR-33a-mimic (33a mimic) and miR-33b-mimic (33b mimic). (d) Screening for candidates of AMOs against miR-33a and miR-33b by efficacy and specificity. (e) Expression levels of miR-33a (left, n = 3) and miR-33b (right, n = 3) in HepG2 cells transfected with the selected AMOs against miR-33a and miR-33b at a concentration of 5 nM. One-way ANOVA with Dunnett’s multiple comparison test. *P < 0.01. (f) Absolute copy number of miR-33a and miR-33b in THP-1 macrophages with or without tumor necrosis factor α (TNF-α) treatment. Two-way ANOVA with Holm–Sidak’s multiple comparisons test. *P < 0.05, **P < 0.01 and ***P < 0.001. (g) Expression levels of sterol regulatory element-binding transcription factor (SREBF1) and ATP binding cassette transporter A1 (ABCA1) in THP-1 macrophages with or without TNF-α treatment determined using quantitative real-time PCR. Two-way ANOVA with Holm–Sidak’s multiple comparisons test. **P < 0.01 and ***P < 0.001. (h) Absolute copy number of miR-33a and miR-33b in HASMCs and EA.hy926 with or without TNF-α treatment (right). Expression levels of SREBF1 and ABCA1 in HASMCs and EA.hy926 with or without TNF-α treatment (left) determined using quantitative real-time PCR. Two-way ANOVA with Holm–Sidak’s multiple comparisons test. *P < 0.05, **P < 0.01 and ***P < 0.001. ns is defined as not significant. All data represent mean ± SEM. Incubation with TNF-α was as follows: 3 h at 25 ng/mL for mouse peritoneal macrophages (PMs), 4 h at 10 ng/mL for mouse vascular smooth muscle cells (VSMCs), and 1 h at 50 ng/mL for mouse aortic endothelial cells (ECs).

