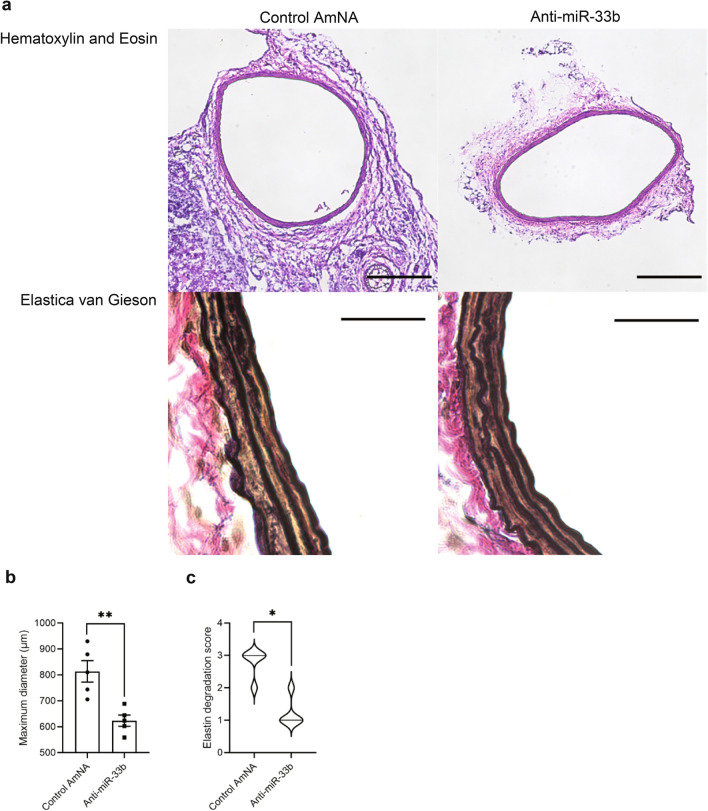
Figure 5.
Histological analyses of AMO-administered CaCl2-induced AAA of miR-33b KI mice. (a) Representative images of hematoxylin–eosin (HE) and Elastica van Gieson (EVG) staining in CaCl2-induced AAA of miR-33b KI mice with administration of the indicated AMOs. Scale bar for HE, 200 µm; for EVG, 20 µm. (b) Maximum diameter of CaCl2-induced AAA with administration of the indicated AMOs, n = 5 in each group. Unpaired two-tailed t test. **P < 0.01. (c) The elastin degradation score of CaCl2-induced AAA with administration of the indicated AMOs, n = 5 in each group. Mann–Whitney test. *P < 0.05. All data represent mean ± SEM.

