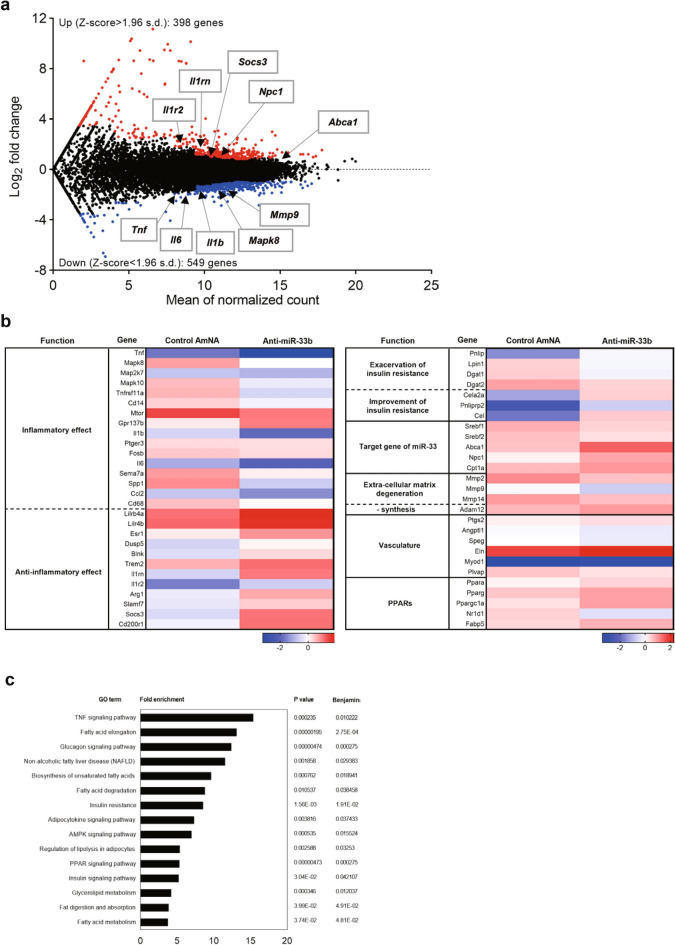
Figure 8.
RNA-seq analysis for CaCl2-induced AAA samples of AMO-administered miR-33b KI mice and anti-miR-33b working hypothesis. (a) MA plot illustrating the number of differentially expressed genes. Red dots: upregulated genes; blue dots: downregulated genes, as determined by log2(fold change) between anti-miR-33b and control AmNA administered CaCl2-induced AAA samples of miR-33b KI mice. (b) Heatmap representation of normalized gene expressions as intensity-based Z-score. (c) Enrichment analyses of integrated pathways for anti-miR-33b injected AAA miR-33b KI mice. (d) Schematic diagram of the effects of anti-miR-33b.


