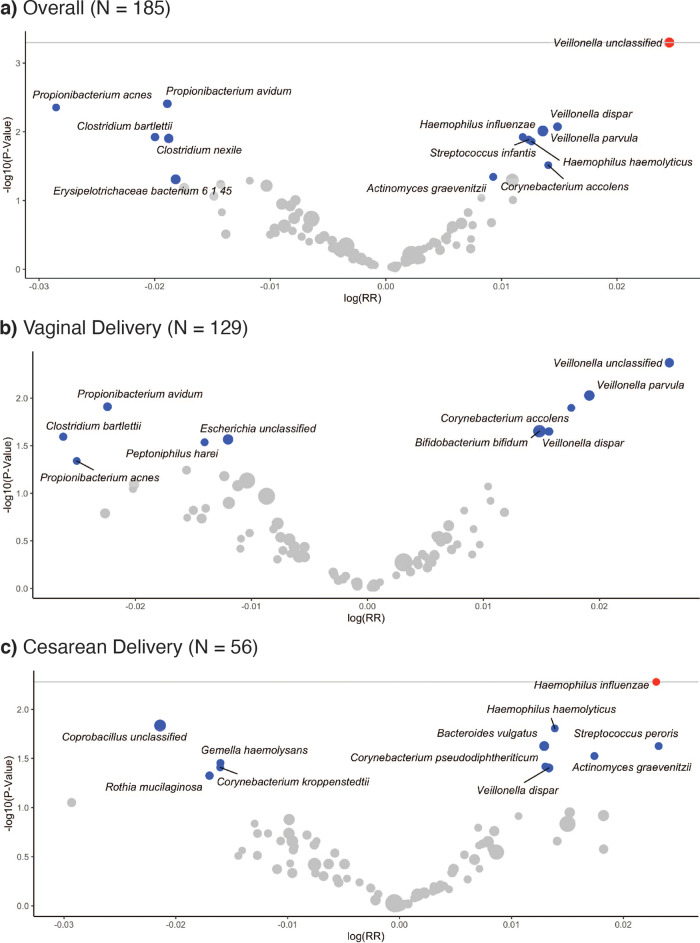
Fig. 2. Volcano plots of GEE adjusted relative risk estimates of the number of infections and symptoms over the first year of life in relation to 6-week metagenomics species relative abundance.
Estimates shown for taxa prevalent in over 10% of subjects. The gray line represents a log10-transformed FDR threshold of 0.1. Blue points indicate statistically significant taxa at α = 0.05. Red points indicate taxa selected by FDR correction. Gray points indicate all other taxa. The size of the points is scaled by relative abundance. Relative risk estimates represent an increased risk of having additional infections or symptoms of infection with each doubling of relative abundance. a Volcano plot of unstratified GEE adjusted for maternal BMI, delivery type, sex, breast feeding at six weeks, perinatal antibiotic use, and gestational age. b Volcano plot of vaginal deliveries adjusted for maternal BMI, sex, breast feeding at six weeks, perinatal antibiotic use, and gestational age. c Volcano plot of cesarean deliveries adjusted for maternal BMI, sex, breast feeding at six weeks, perinatal antibiotic use, and gestational age. Three taxa were removed due to high RRs and low p-values. GEE generalized estimating equation, N sample size, RR relative risk.

