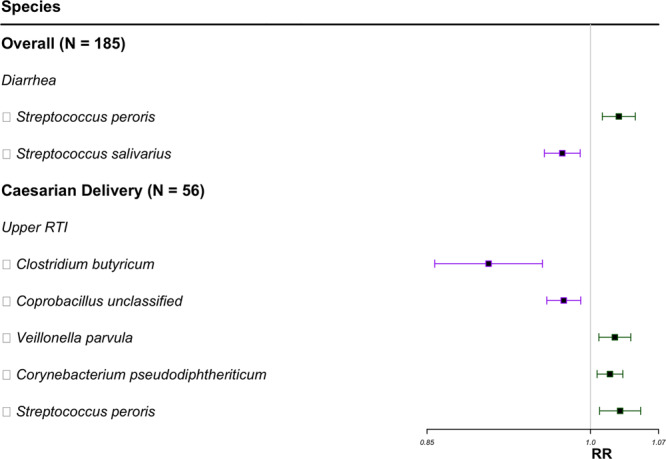
Fig. 3. Forest plot of metagenomics species associated with the number of infections and symptoms of infections in the first year of life.

Species selected by FDR correction presented in the forest plot. Species for vaginal deliveries did not meet the FDR threshold of 0.1. Squares represent RR, and horizontal lines represent 95% confidence intervals. Green represents a positive association, and purple represents a negative association. Relative risk estimates represent an increased risk of having an additional upper respiratory infection or an increased risk of experiencing diarrhea with each doubling of the relative abundance. N sample size, RTI respiratory tract infection, RR relative risk.
