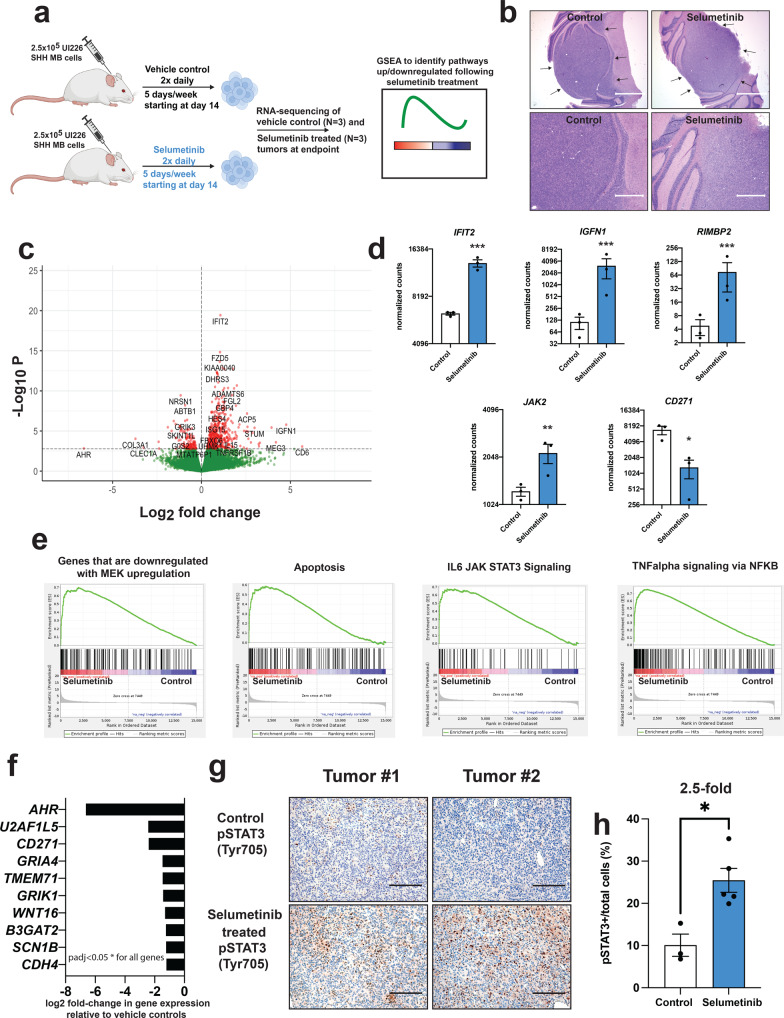
Fig. 1. Pathways and genes differentially expressed in selumetinib-treated xenografts.
a Schematic of workflow used to identify compensatory pathways in SHH xenograft tumors following MEK inhibitor treatment. A portion of this schematic, including mouse, syringe, and cell icon images, was created with BioRender.com. b Representative H&E images of FFPE sections from control (left) and selumetinib-treated (right) UI226 SHH MB xenografts. Scale bars: 1500 μm (upper) and 600 μm (lower). c Volcano plot depicting the log2 fold change and p-values in RNA-seq data with points in red identifying the 576 significantly differentially expressed genes (FDR < 0.05). d Normalized counts for representative differentially expressed transcripts from RNA-seq data. IFIT2 (p = 6.33E–16), IGFN1 (p = 0.0002), RIMBP2 (p = 0.00049) and JAK2 (p = 0.0041) are increased while CD271 (p = 0.047) expression is decreased in selumetinib-treated UI226 SHH MB xenografts relative to vehicle controls. p < 0.05 *, p < 0.01**, p < 0.001***. Expression differences were calculated using the DESeq results function. Differentially expressed genes were identified using a q-value (Benjamini-Hochberg corrected p-value) cut-off of 0.05, which coincides with a p-value of 0.00168. e GSEA demonstrating that genes associated with a downregulated MEK signature, increased JAK/STAT3, TNFalpha, and apoptosis signaling are enriched in genes sets that are upregulated in selumetinib-treated xenografts. padj < 0.05* for all signatures. f Most significantly downregulated genes in selumetinib-treated xenografts. Differentially expressed genes were identified using a q-value (Benjamini-Hochberg corrected p-value) cut-off of 0.05, which coincides with a p-value of 0.00168. padj < 0.05* for all genes. g Representative images of IHC staining for pSTAT3 (Tyr705) in FFPE sections from two independent control (upper) and selumetinib-treated (lower) UI226 SHH MB xenografts. Scale bar: 150 μm. h Quantitative analyses of IHC pSTAT3 (Tyr705) staining in vehicle control (white) and selumetinib-treated (blue) xenografts. The proportion of pSTAT3+ cells for each sample was calculated using QuPath and expressed as the total number of pSTAT3+ cells relative to the total number of cells in each image (pSTAT3- nuclei (hematoxylin-stained) and pSTAT3+ cells). Significance was calculated using a two-tailed t-test. Error bars: SEM. p = 0.011.

