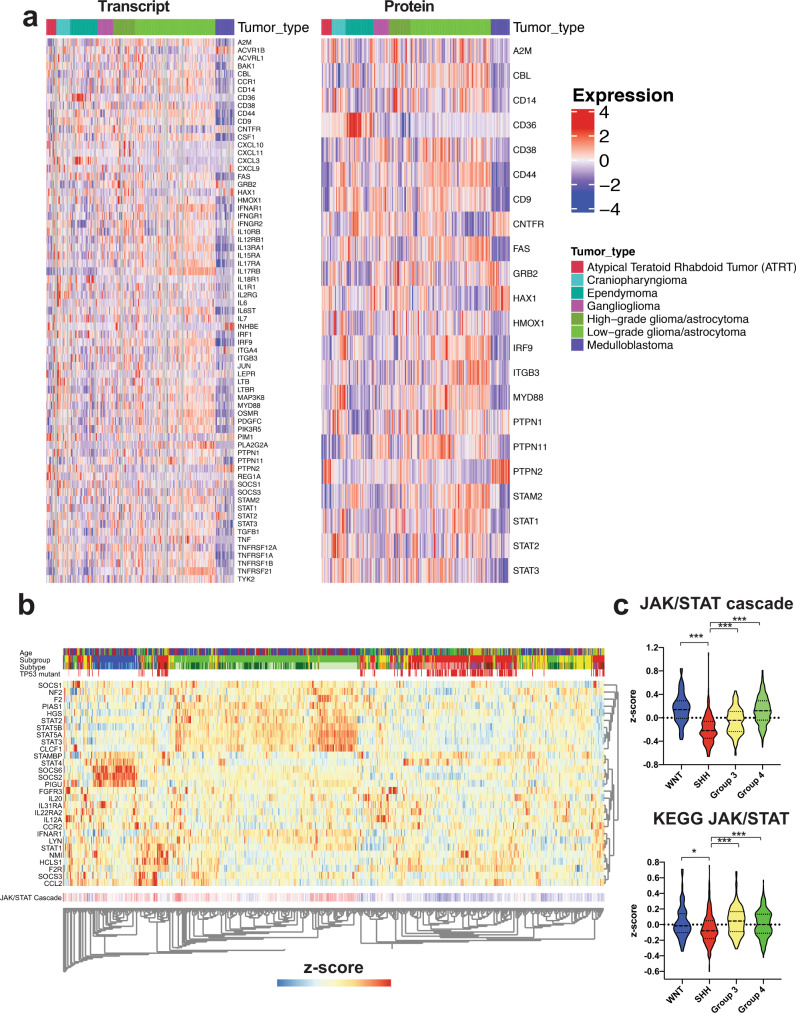
Fig. 2. The JAK/STAT3 signaling signature is significantly lower in SHH MB primary patient tumors.
a Heatmap generated by ProTrack [http://pbt.cptac-data-view.org/] illustrating transcript (left) and protein (right) levels of Hallmark IL6 JAK/STAT3 signaling signature components across 218 samples representing several classes of childhood brain cancer. Individual samples are aligned vertically into columns, with the 22 MB samples colored purple. JAK/STAT3 signaling components were retrieved from Supplementary Data 5. Signaling components absent from the ProTrack database are omitted from visualization. b Unsupervised hierarchical clustering restricted to the JAK/STAT signaling cascade-associated transcripts across the 4 MB subgroups from the Cavalli et al.5 dataset representing 763 patient samples (WNT: N = 70 samples in blue; SHH: N = 223 samples in red; Group 3: N = 144 samples in yellow; Group 4: N = 326 samples in green). c Violin plots depicting z-scores for 2 JAK/STAT signaling cascade transcriptome signatures across the 4 MB subgroups. Significance was determined by ANOVA with a Tukey’s test for multiple comparisons. p < 0.05*, p < 0.001***. For all violin plots, the center line is the median, the 25th and 75th percentiles are depicted by the lower and upper dotted lines, respectively, and the extremes of the distribution extend to the minima and maxima.

