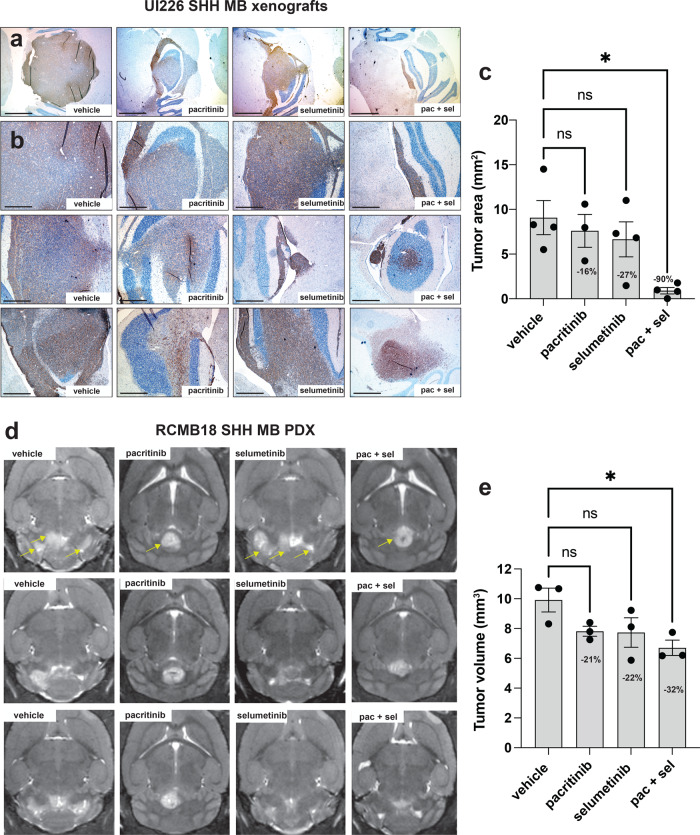
Fig. 7. MEK + JAK/STAT3 inhibition decreases tumor growth in 2 SHH MB in vivo xenograft models.
Representative IHC images of STEM121 levels at low magnification (a) and higher magnification (b) from three independent tumors from each of the vehicle control, pacritinib, selumetinib, and combination pacritinib + selumetinib treatment groups. Scale bars: 1500 μm (a) and 600 μm (b). c ImageJ quantification of UI226 tumor area from STEM121 stained slides representing the vehicle control (N = 4), pacritinib (N = 3), selumetinib (N = 4), and combination pacritinib + selumetinib (N = 4) treatment groups. Results were analyzed using ANOVA and a Dunnett’s test for multiple comparisons. Error bars: SEM. p < 0.05*. vehicle vs pac/sel, p = 0.0105. d Representative MRI images from three independent RCMB18 tumors representing the vehicle control, pacritinib, selumetinib, and combination pacritinib + selumetinib treatment groups. Arrows denote individual or multiple tumor lobes in representative images from each treatment group. e ImageJ quantification of RCMB18 tumor volume from compiled MRI images representing the vehicle control (N = 3), pacritinib (N = 3), selumetinib (N = 3), and combination pacritinib + selumetinib (N = 3) treatment groups. Results were analyzed using ANOVA and a Dunnett’s test for multiple comparisons. Error bars: SEM. p < 0.05*. vehicle vs pac/sel, p = 0.0308.

