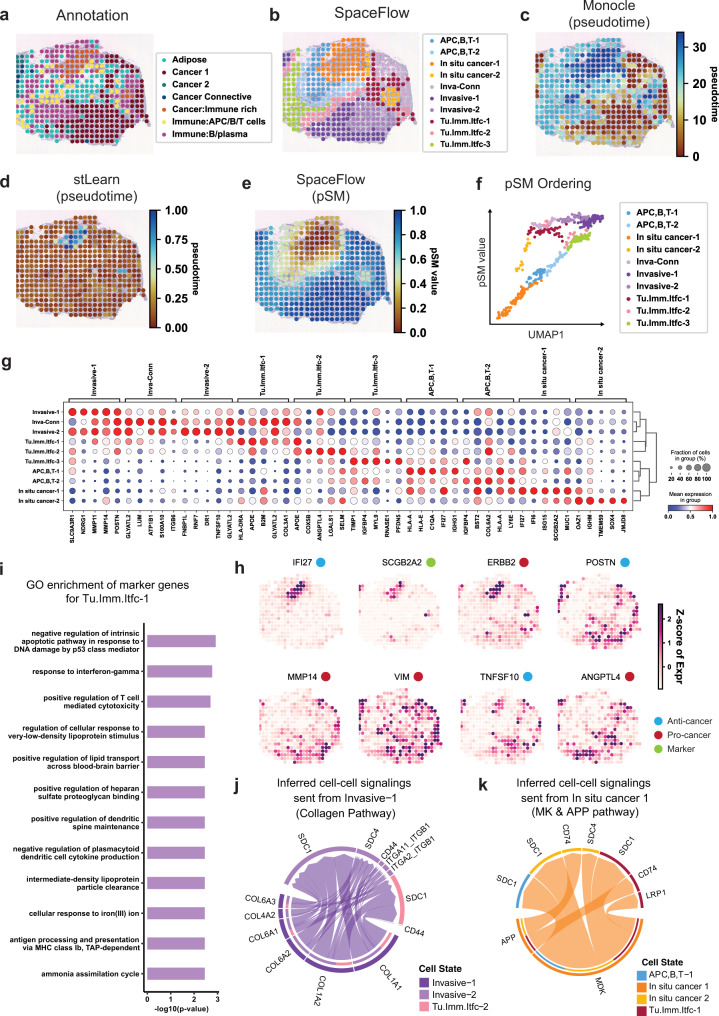
Fig. 5. SpaceFlow identifies tumor-immune cell-cell communication in human breast cancer ST data.
a H&E image and annotation from the original study for the spots of sample G in human breast cancer ST data56. b Domain segmentation from SpaceFlow. c Spatial visualization of pseudotime calculated by Monocle. d Spatial visualization of pseudotime calculated by stLearn. e The pSM from SpaceFlow. f The pSM versus UMAP component 1 from low-dimensional embeddings colored by annotations from SpaceFlow. g Dot plot of the gene expression of domain-specific markers. The dot size represents the fraction of cells in a domain expressing the marker and the color intensity represents the average expression of the marker in that domain. h Spatial expression of top domain marker genes with anti-cancer, pro-cancer, or dual function labels. i Gene Ontology (GO) enrichment for the top domain-specific genes (48 genes) in the identified Tumor-Immune-Interface-1 (Tu.Imm.Itfc.1). Enriched GO terms are presented as -log10(p-value) using topGO analysis. P values were obtained using the one-sided Fisher’s exact test without multiple-testing correction. P values < 0.005 were considered significant. Space-constrained CellChat inferred cell-cell communications with cell-cell communications signaling sent from Invasive-1 in Collagen pathway (j) and from In-situ cancer 1 in MK & APP pathways (k).

