
Fig. 6. DNA-binding dissociation energies are different for the HTH and Stoperator domains.
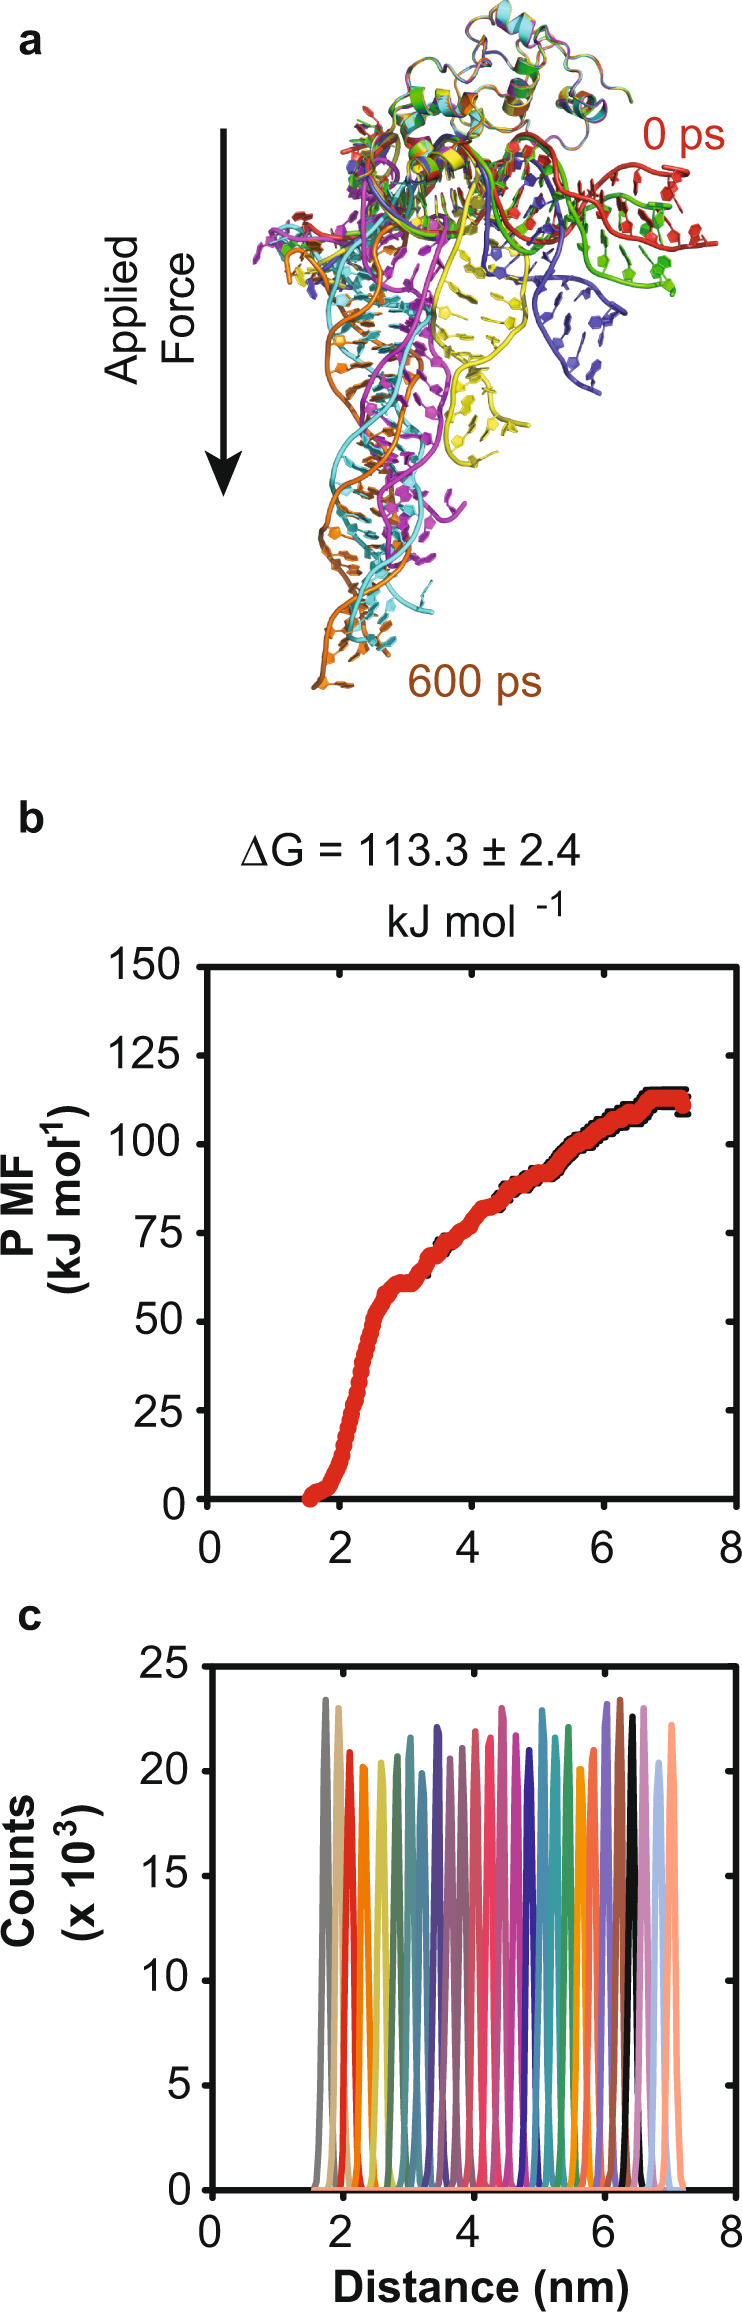
Steered molecular dynamics techniques were employed alongside umbrella sampling methods to simulate DNA dissociation from full-length repressor. a Frames extracted along the COM pulling trajectory are superimposed to highlight dissociation path. All structural representations were prepared using Pymol 2.4.1 in ribbon view with frames corresponding to t = 0, 100, 200, 300, 400, 500, and 600 ps colored as red, green, blue, yellow, magenta, cyan, and orange, respectively. The TipsytheTRex repressor protein structure is position restrained, while DNA is sequentially pulled along a defined path by application of a static force vector. The resulting SMD trajectories were then subjected to umbrella sampling techniques to calculate Potential of Mean Force (PMF). The amplitude of a resulting plot of PMF versus distance between protein and DNA centers-of-mass yields an estimate of the dissociation free energy (b). Adequate sampling was confirmed by weighted histogram analysis (c) and error estimation was obtained by bootstrap methods (n = 200). Figure labeling is present to indicate binding dissociation energy value, ΔG.