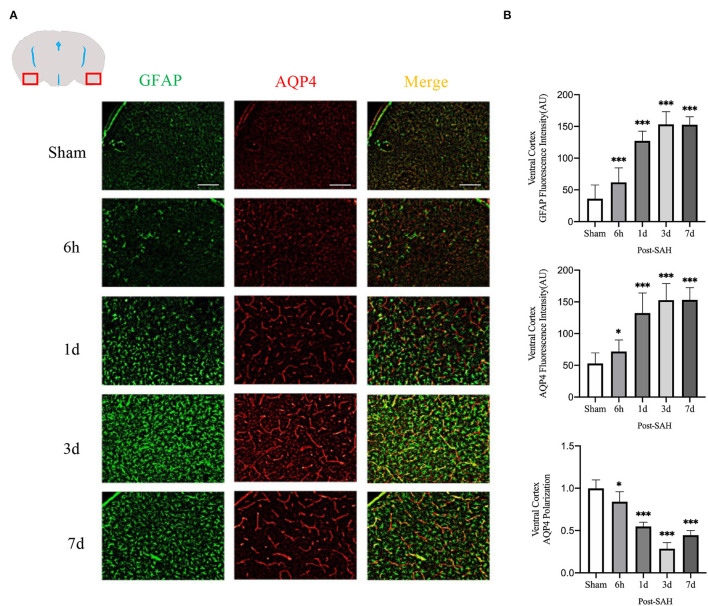
Figure 4.
Ventral cortex plots of AQP4 and GFAP fluorescence among different groups: (A) Schematic of ventral cortex along with representative immunofluorescence plots; Scale bar, 100 μm; (B) Statistical plots of AQP4 mean fluorescence intensity, GFAP mean fluorescence intensity and polarity of AQP4 in the ventral cortex of different groups of mice. Compared with sham group, the mean fluorescence intensity of AQP4 was significantly higher at 6 h, 1d, 3d, and 7d (P = 0.0349, P < 0.0001, P < 0.0001, P < 0.0001; n = 20–35/group). Compared with sham group, the mean fluorescence intensity of GFAP was significantly higher at 6 h, 1d, 3d, and 7d (P < 0.0001, P < 0.0001, P < 0.0001, P < 0.0001; n = 20–35/group). Compared with sham group, the polarity of AQP4 was significantly decreased at 6 h, 1d, 3d, and 7d (P = 0.0493, P < 0.0001, P < 0.0001, P < 0.0001; n = 5/group). *P < 0.05, ***P < 0.001; ns, not statistically significant. One-way ANOVA, Tukey's post-hoc test.

