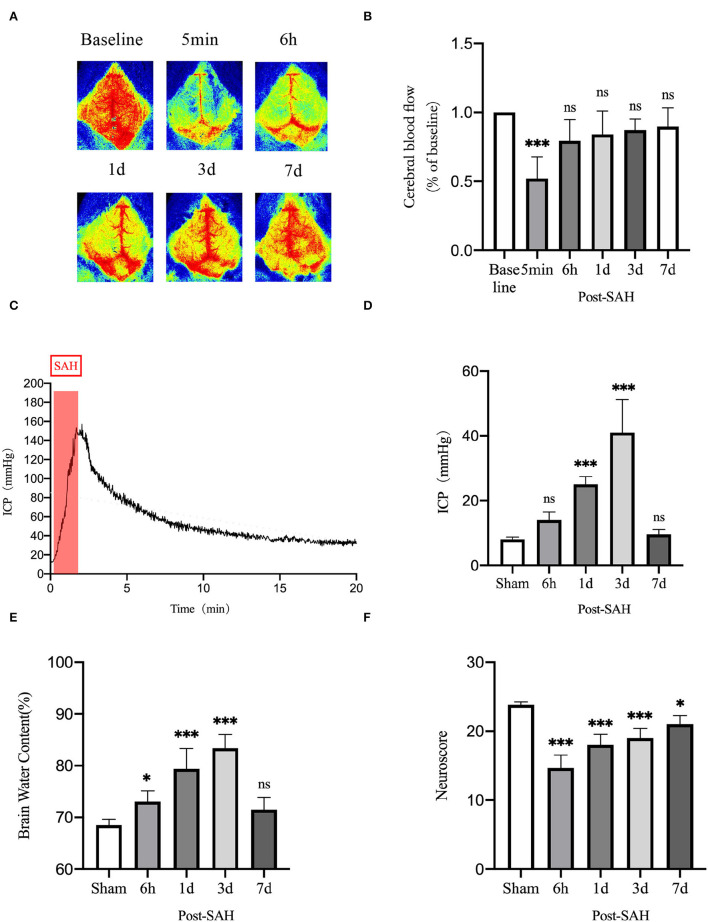
Figure 8.
Neurobehavioral function judgment of mice among different groups. (A) Schematic of laser speckle in the same mouse at different time points; (B) Statistical plots of laser speckle perfusion results in mice, with all results compared to baseline values, n = 5/group. (C) SAH model mice with real-time intracranial pressure monitoring. (D) Statistical plots of intracranial pressure results at different time points in mice after SAH, all compared with the sham group, n = 5–6/group. (E) Statistical results of mouse brain water content, n = 6/group. (F) Mouse neurological scoring results, n = 6/group; *P < 0.05, ***P < 0.001; ns, not statistically significant. One-way ANOVA, Tukey's post-hoc test.

