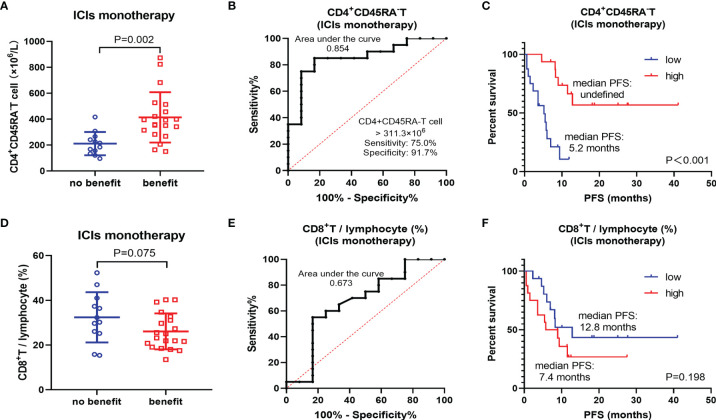
Figure 2.
Subgroup analysis of ICIs monotherapy. (A) Differences of CD4+CD45RA− T cell between benefit group and non-benefit group. (B) ROC curve of CD4+CD45RA− T cell. (C) Kaplan–Meier survival curve of different levels of CD4+CD45RA− T cell. (D) Differences of CD8+ T/lymphocyte (%) between benefit group and non-benefit group. (E) ROC curve of CD8+ T/lymphocyte (%). (F) Kaplan–Meier survival curve of different levels of CD8+ T/lymphocyte (%).

