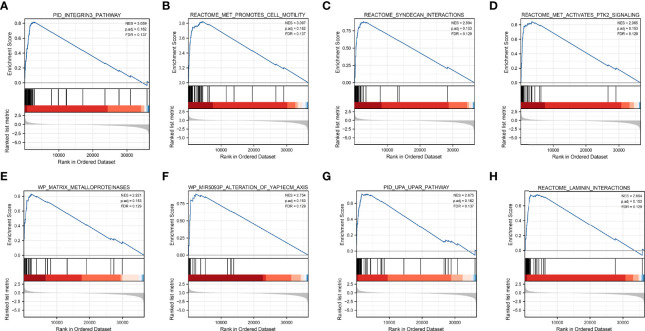
Figure 5.
Gene set enrichment analysis of DCBLD1 in HNSCC. (A) Integrins 3 pathway. (B) Met promotes cell motility. (C) Syndecan interactions. (D) Met activates PTK2 signaling. (E) Matrix metalloproteinases. (F) MIR5093P alteration of the YAP1ECM axis. (G) UPA UPAR pathway. (H) Laminin interactions. NES, normalized enrichment score; FDR, false discovery rate.

