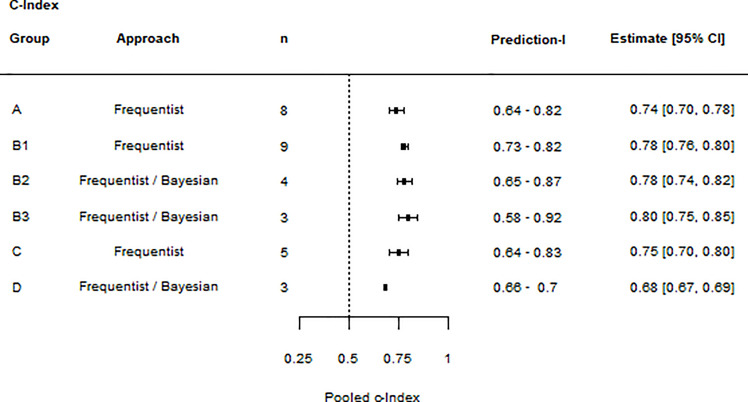
Figure 4.
Summary forest plot of c-Index meta-analyses: The forest plot lists the results of individual meta-analyses. For each meta-analysis, the nomogram group, the statistical approach, the number of values included (n), the prediction interval (lower limit – upper limit), and the c-Index summary estimate (estimate and 95% CIs) are given.

