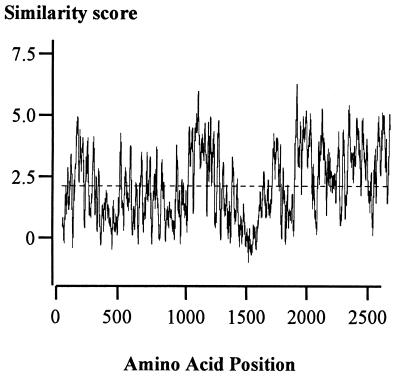
FIG. 3.
Multiple sequence comparison of the protein sequences XptA1 and XptA2 from X. nematophilus and TcbA and TcdA from P. luminescens using the package Plotsimilarity. Scores at amino acid positions along the alignment are presented (Henikoff-Henikoff amino acid similarity score, which ranges from −4 to +11), with the average similarity score represented by a dashed line.

