
Figure 6.
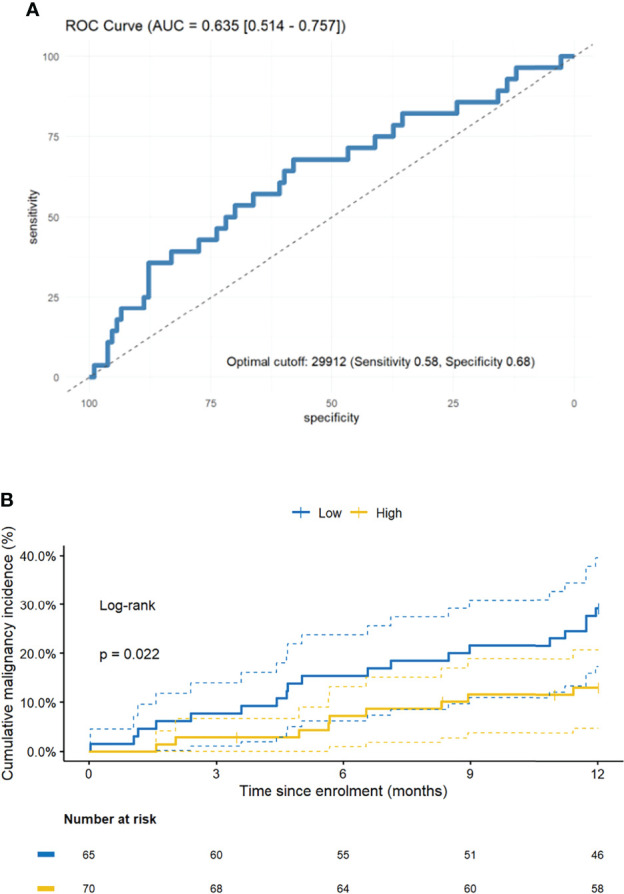
Decreased mHLA-DRd is associated with subsequent malignancy development. (A) Receiver-operator characteristic (ROC) curve for prediction of malignancy in the year following mHLA-DRd quantification. Predictive performance is given [area under curve (AUC) and 95% confidence interval] as well as the optimal cut-off and corresponding sensitivity and specificity. (B) Kaplan-Meier curve demonstrating cumulative incidence of malignancy stratified by mHLA-DRd. (unadjusted and adjusted hazard ratios and P values are given in Table 3 ; log-rank test for difference between curves is provided in-plot).