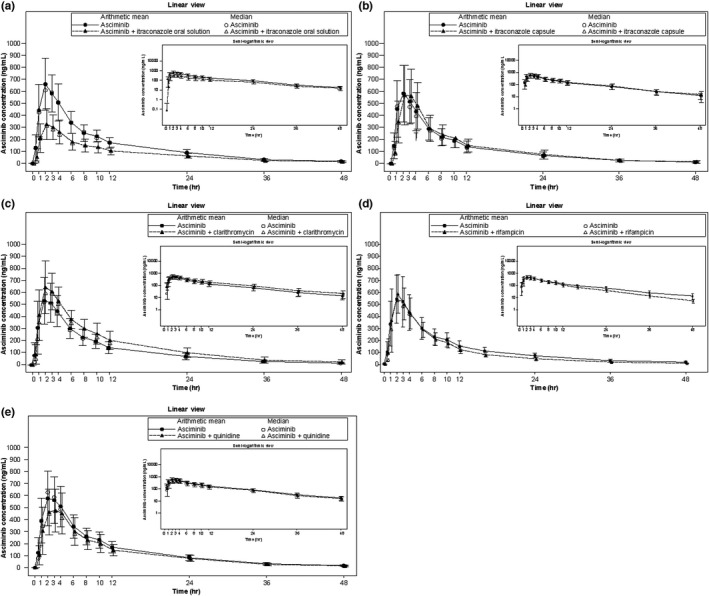
FIGURE 1.

Arithmetic mean (SD) and median plasma concentration‐time profiles for asciminib in cohort 1 (itraconazole oral solution, a), cohort 6 (itraconazole capsule, b), cohort 5 (clarithromycin, c), cohort 3 (rifampicin, d), and cohort 2 (quinidine, e). Linear views are shown in the main panel, with semilogarithmic views in the inset
