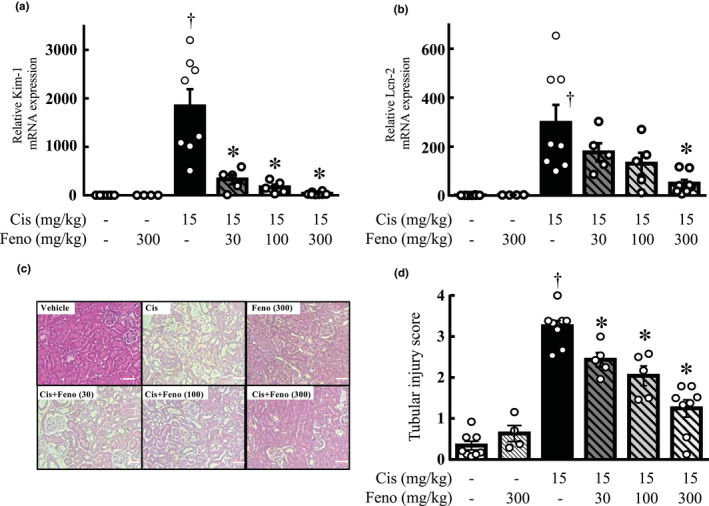
FIGURE 1.

Effect of fenofibrate on cisplatin‐induced nephrotoxicity. (a, b) The mRNA expression levels of kidney injury markers Kim‐1 (a) and Lcn‐2 (b) in the kidneys of mice in each group. (c) Representative hematoxylin and eosin staining (HE) of the kidney section of the control mice, cisplatin‐injected mice with vehicle or fenofibrate. The scale bar indicates 100 μm. (d) Quantitative analysis of renal damage scores. Values are expressed as mean ± SEM. Cis, cisplatin; Feno, fenofibrate. † p < 0.05 versus vehicle mice, *p < 0.01 versus cisplatin mice, n = 4–9 in each group
