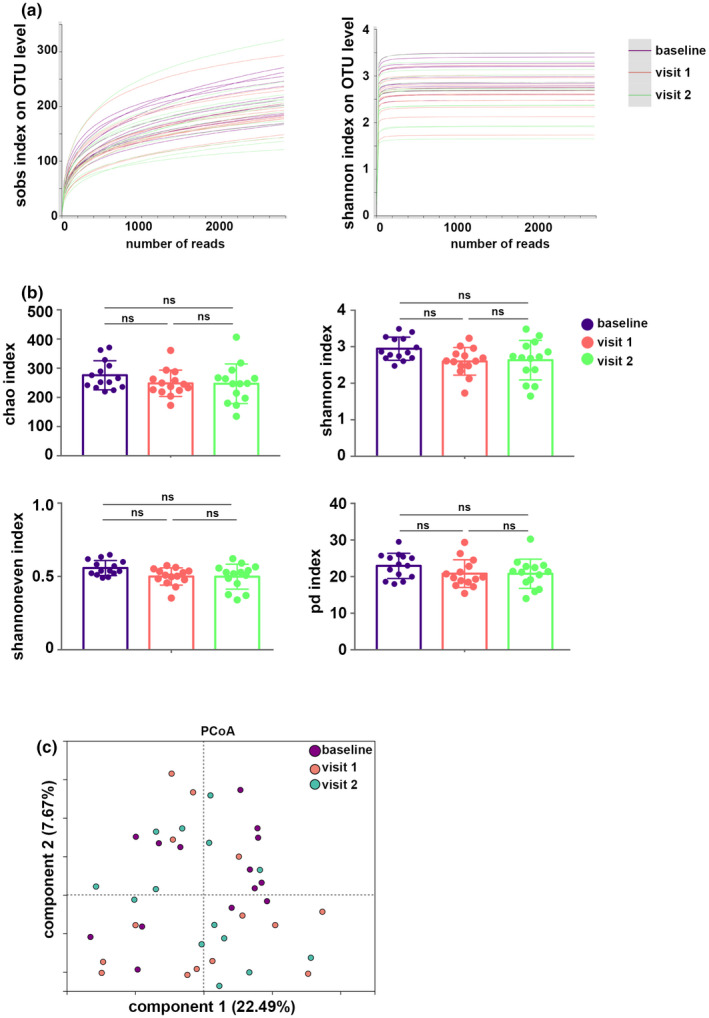
FIGURE 1.

Basic estimations of airway bacteriome. (a) Rarefaction curves (Shannon and Sobs indices) on operational taxonomic unit (OTU) level. (b) Chao, Shannon, Shannoneven, and phylogenetic diversity (PD) indices of the airway bacteriome. (c) Principal coordinate analysis (PCoA) based on Bray–Curtis distances. NS, not significant.
