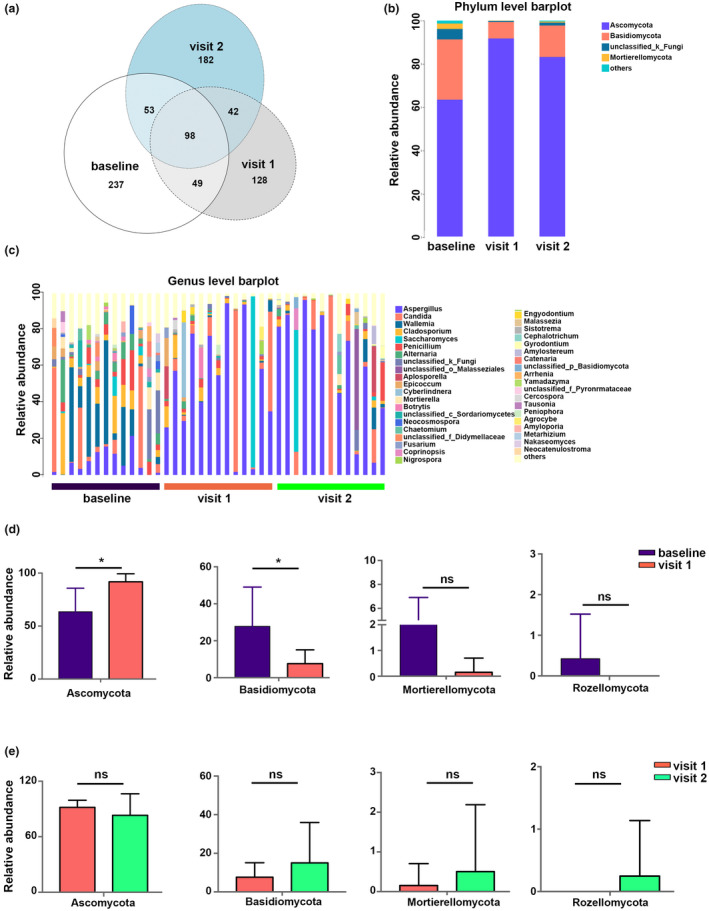
FIGURE 4.

Taxa distribution and compositional comparisons of airway mycobiome. (a) Venn diagram illustrating the fungal operational taxonomic units (OTUs) in sputum for the baseline, visit 1, and visit 2. (b, c) Bar charts of the airway fungal composition at the phylum and genus levels. (d) Comparisons of the most abundant phyla between the baseline and visit 1. Corrected *p < 0.05. (e) Comparisons of abundant phyla between visit 1 and visit 2. NS, not significant.
