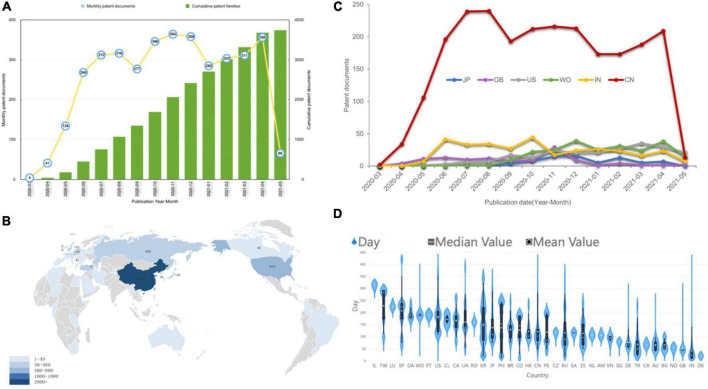
FIGURE 1.
Current tendency for time and geographical distribution of COVID-19 patents. (A) The annual and cumulative number of COVID-19 patents. (B) The country landscape by nationalities of jurisdictions. The darker the color, the more patents. (C) The map shows the number of patent families by the top six locations of patent inventors temporally. (D) Violin plot of the time period between patent application and publication. The short white horizontal line is the median; the white dot is the mean; the black bar in the center of the violin is the interquartile range; and the black lines stretching from the bar are defined as the first quartile –1.5 IQR and third quartile + 1.5 IQR.

