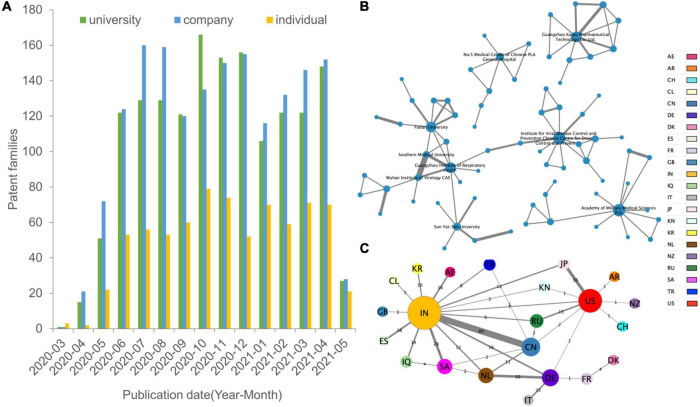
FIGURE 2.
Spatial and institutional dimensions of research collaboration. (A) The bar chart shows the patent numbers for each assignee type of institution. (B) Top collaboration partners. The nodes (organizational patent assignee colored with country) and edges (collaboration) in the network visualization map represent the co-assignee relations. The institutional collaboration network does not include the individual assignee and labels names of top active institutions by Cytoscape. (C) Networks of country relationship modes. Nodes (individual and organizational patent assignees) denote locations, and edges denote the count of domestic, bilateral, and multilateral country collaborations. Node size is scaled to the numerical value of the network degree (co-patent number), while the thickness of the edges is determined by the numerical value of the network weighted degree (frequency of cooperation). Countries are represented in different colors. The regional cooperation network is displayed in the “yFiles Organic layout” based on the force-directed layout paradigm by Cytoscape.

