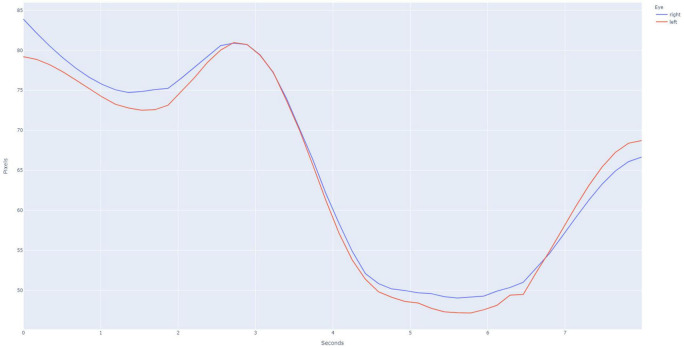
FIGURE 2.
Example pupillary light reflex (PLR) curve for a normal subject, as is evidenced by the large amount of constriction after the light stimulus is applied at the 3 s time point. Binocular recording of the PLR is obtained using the PupilScreen application such that the simultaneous constriction of both the right eye (blue curve) and the left eye (red curve). The current generation of PupilScreen produces PLR curves in terms of pixels and seconds.

