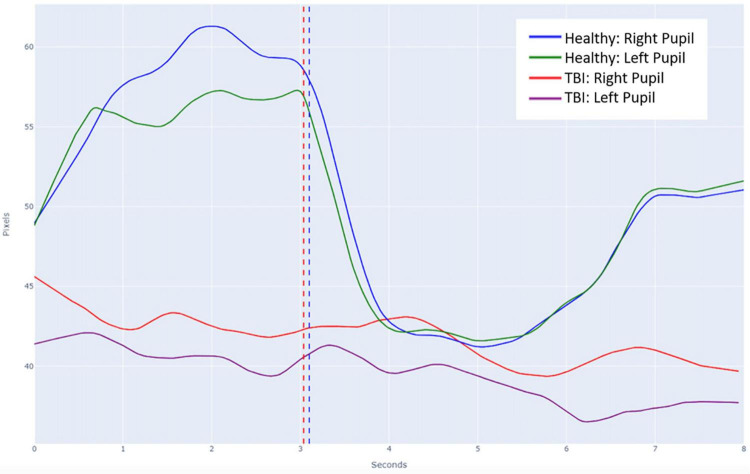
FIGURE 4.
Average pupillary light reflex (PLR) curves overlayed on a single plot for both normal and abnormal subjects. The vertical dashed line in blue represents the timing of the light stimulus for the normal healthy recordings and the vertical dashed line in red represents the slightly differential timing of the light stimulus for the abnormal TBI recordings.

