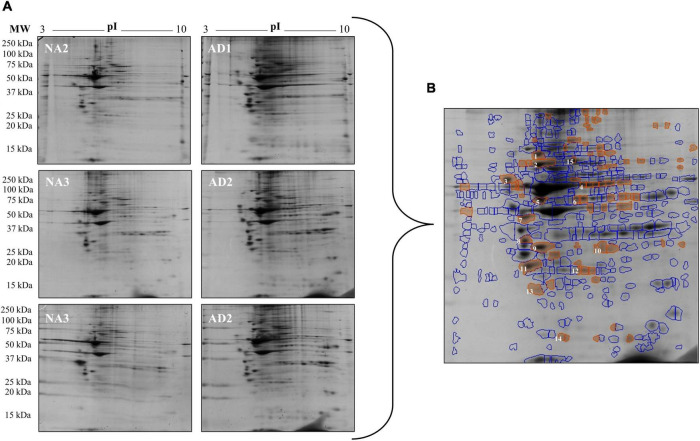
FIGURE 5.
Changes in protein expression in fibroblasts from FAD patients (AD1 and AD2) and fibroblasts from control individuals (NA2 and NA3). Proteins were separated by molecular weight and isoelectric point using 2-DE gels. (A) Scanned images of the 2-DE gels developed with Coomassie blue; 2 biological replicates and 2 experimental replicas are presented. (B) Representative image of the 68 spots (red) with significant differences reported by SameSpot software, of which 15 proteins were identified by reference proteomic maps derived from fibroblasts. The analysis of expression is presented in Table 4.

