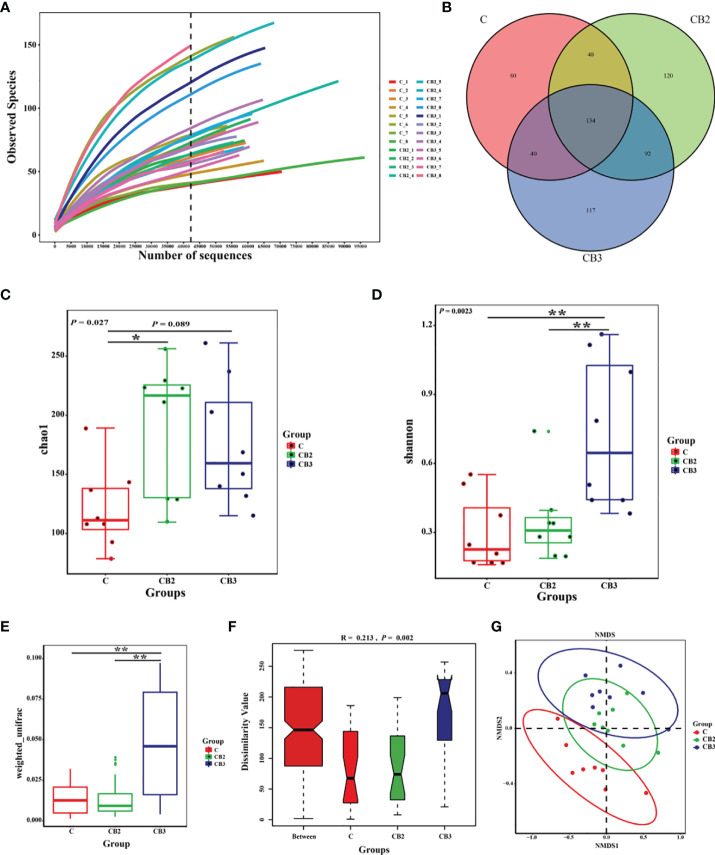
Figure 8.
Effects of dietary chitosan oligosaccharides (COS) and Clostridium butyricum synbiotic supplementation on ileal microbiota in early-weaned pigeon squabs. (A) Rarefaction curves. (B) Venn diagram of operational taxonomic units (OTUs). (C) Microbiota richness is represented by Chao1 index. (D) Microbiota diversity is represented by Shannon index. (E) Weighted_unifrac distance. (F) Analysis of similarities based on OTUs. (G) Non-metric multidimensional scaling (NMDS) analysis plot of bacterial communities. Values are means with the SEM of eight squabs. *p < 0.05 and **p < 0.01. C group, control group, squabs fed with artificial crop milk; CO group, squabs fed with artificial crop milk + 150 mg/kg COS; CB2 and CB3 group, squabs fed with artificial crop milk + 150 mg/kg COS + 300 and 400 mg/kg C butyricum, respectively.

