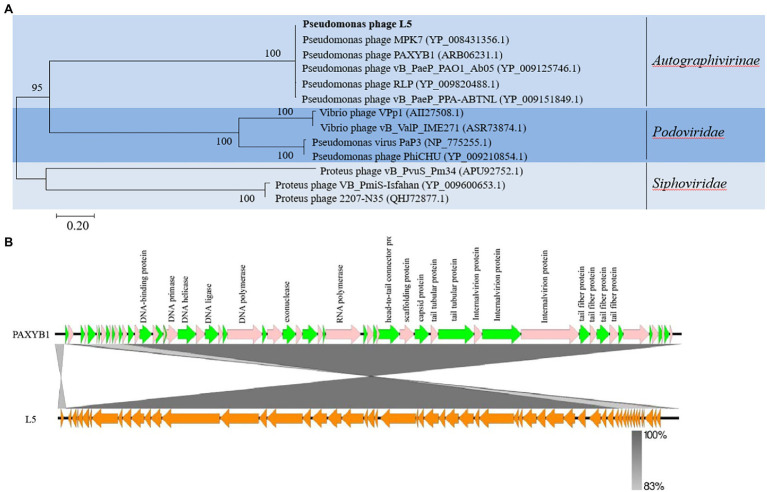
Figure 3.
(A) Phylogenetic analysis of P. aeruginosa phage L5 and related phages. The terminase large subunits of selected phages were compared using the ClustalW program, and the phylogenetic tree was generated using the neighbor-joining method with 1,000 bootstrap replicates. (B) Comparison of the genome sequence of phage PAXYB1(top) with L5 (bottom). Predicted ORFs and the direction of transcription are indicated by block arrows. Conserved regions are shaded in gray. The color intensity corresponds to the sequence identity level (83 to 100%). Genomic comparisons were performed using BLASTn. Similarities with E values lower than 0.00001 are plotted. The figure was produced using Easyfig 2.2.5 (Sullivan et al., 2011).

