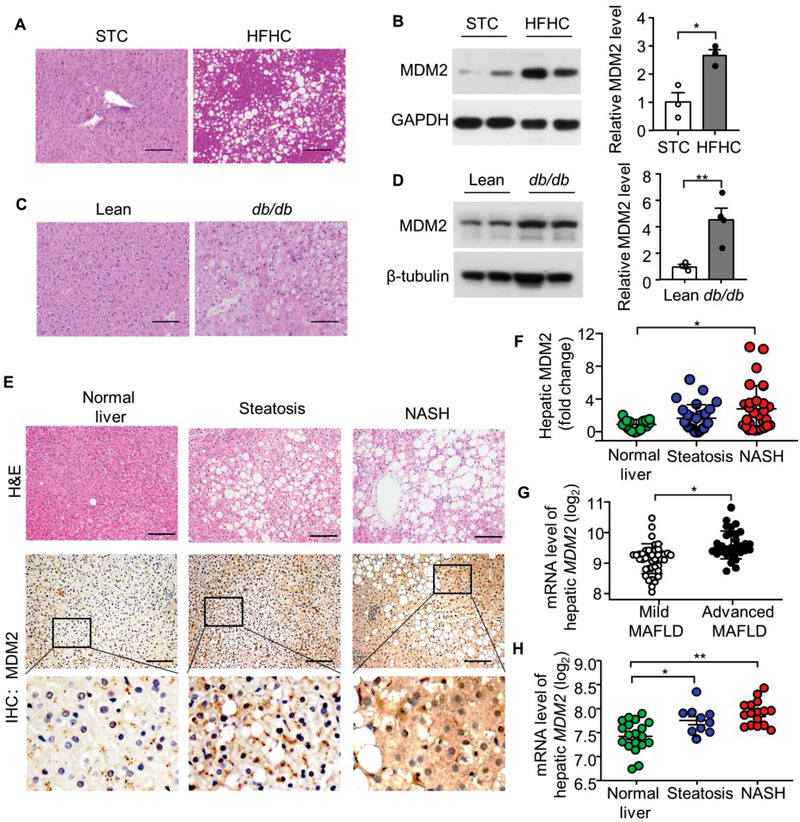
Figure 1.

Hepatic expression of MDM2 is augmented in mouse models and humans with MAFLD. A,B) Male C57BL/6J mice fed a STC or HFHC diet for 16 weeks were used. A) Hematoxylin and Eosin (H&E) staining of liver sections. B) Immunoblotting analysis of MDM2 and GAPDH in liver lysates. The right panel is densitometric analysis for the relative abundance of MDM2 normalized with GAPDH (n = 3). C,D) 12‐week‐old male db/db obese mice and their lean controls were used. C) H&E staining of liver sections. D) Immunoblotting analysis of MDM2 and β‐tubulin in liver lysates. The right panel is densitometric analysis of MDM2 normalized with β‐tubulin (n = 4). E) Liver sections of morbidly obese humans with simple steatosis (Steatosis; n = 29) or steatosis, inflammation, and fibrosis (NASH; n = 28) or no aforementioned pathological change (Normal liver; n = 16) were subjected to H&E staining and immunohistochemical (IHC) staining of MDM2. F) Quantification of the relative expression of MDM2 in the three groups. G) Hepatic mRNA levels of MDM2 in human with different degrees of MAFLD. Microarray data GSE49541 was downloaded from the Gene expression omnibus database. Mild MAFLD (fibrosis stage 0–1; n = 40); Advanced MAFLD (fibrosis stage 3–4; n = 32). H) Hepatic mRNA levels of MDM2 in human with clinically defined normal (n = 19), steatosis (n = 10), and NASH (n = 16). Dataset was download from ArrayExpress public repository (Accession number: E‐MEXP‐3291) Scale bar: 100 μm. Representative images are shown. All data are presented as mean ± SEM. *p < 0.05 and **p < 0.01. (Two‐tailed independent Student's t‐test in panel B,D,G) and Kruskal Wallis test in panel F), and One‐way ANOVA with Tukey test for panel H).
