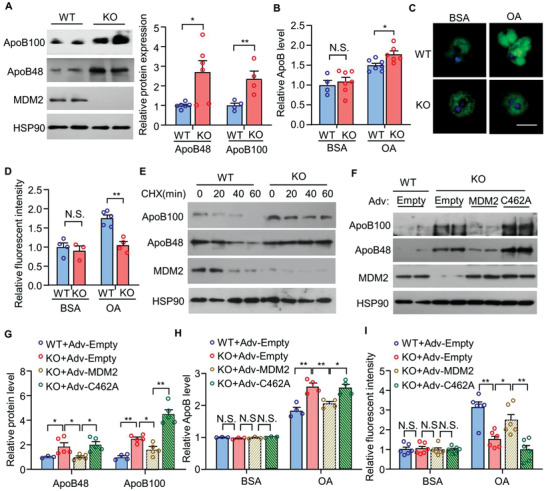
Figure 4.

The E3 ligase activity of MDM2 is indispensable for its suppressive effects on ApoB expression and secretion in primary hepatocytes under obese condition. Primary hepatocytes were isolated from H‐MDM2‐KO and WT littermates fed the HFHC diet for 12 weeks. A–D) Primary hepatocytes were treated with 0.4 × 10⁻³ m oleic acid (OA) conjugated with BSA or BSA as control for 8 h, and subjected to A) immunoblotting analysis of ApoB100, ApoB48, MDM2, and HSP90. The bar chart is relative expression levels of ApoB100 and ApoB48 normalized with HSP90 (n = 4–6). B) The relative ApoB levels in the culture medium (n = 4–7). C) The cells were fixed and stained with BODIPY lipid probes (green) and DAPI (blue) (scale bar: 10 μm). D) The relative intensity of BODIPY green fluorescence over cell size (n = 3–5) in panel C). Each data point represents the average BODIPY intensity in an area of interest. E) Primary hepatocytes were treated with cycloheximide (CHX; 50 μg mL−1) for different time points, followed by immunoblotting analysis as indicated. F–I) Primary hepatocytes were infected with adenovirus encoding empty control, wild‐type (WT) MDM2, or its E3 ligase defective mutants C462A for 48 h. The infected hepatocytes were treated with 0.4 × 10⁻³ m OA or BSA for 8 h, and then subjected to F) immunoblotting analysis. G) The bar chart is densitometric analysis of hepatic ApoB normalized with HSP90 in panel F (n = 3–5). H) The relative ApoB levels in culture medium normalized with protein concentration (n = 3–4). I) BODIPY lipid staining (n = 6). Representative images are shown. All data are presented as mean ± SEM. *p < 0.05 and **p < 0.01. (Two‐tailed independent Student's t‐test in panel A,B,D) or One Way ANOVA with Tukey test in panel G–I). Not statistical significance (N.S.).
