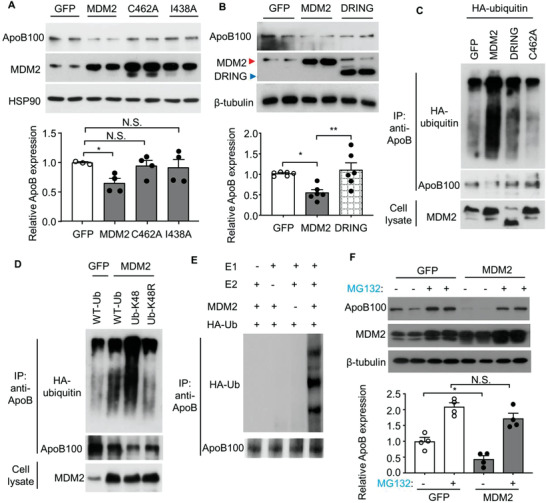
Figure 5.

The E3 ubiquitin ligase MDM2 induces proteasomal degradation and K48‐linked ubiquitination of ApoB in HepG2 cells. A,B) HepG2 cells were transfected with plasmids encoding for wild‐type (WT) MDM2 or its E3 ligase defective mutants including C462A or I438A mutant, or truncated MDM2 without RING finger domain (DRING) or GFP control for 48 h, followed by immunoblotting analysis. The bar charts in the lower panels are densitometric analyses of ApoB normalized with HSP90 or β‐tubulin (n = 3–6). C) HepG2 cells were transfected with plasmids encoding HA‐ubiquitin and WT‐MDM2 or its E3 ligase defective mutants or GFP control as indicated for 48 h. D) HepG2 cells were transfected with plasmids expressing MDM2 or GFP, and WT‐Ub, Ub‐K48, or Ub‐K48R mutant as indicated for 48 h. C,D) The transfected cells were subjected to immunoprecipitation (IP) using an anti‐ApoB antibody, followed by immunoblotting as indicated. E) In vitro ubiquitination assay. The recombinant E1 and E2 enzymes, MDM2, HA‐tagged ubiquitin (Ub) proteins, and native ApoB protein were added to the ubiquitination reaction mix, followed by IP of ApoB and immunoblotting analysis as indicated. F) Immunoblotting analysis of ApoB and MDM2 in HepG2 cells transfected with WT MDM2 or GFP with or without MG132 (10 × 10−6 m) for 6 h. The lower panel is densitometric analysis of ApoB100 normalized with β‐tubulin (n = 4). All data are presented as mean ± SEM. *p < 0.05 and **p < 0.01. (One‐way ANOVA with Tukey test for panel B) and F) or two‐tailed independent Student's t‐test for panel A). N.S. (Not significant).
