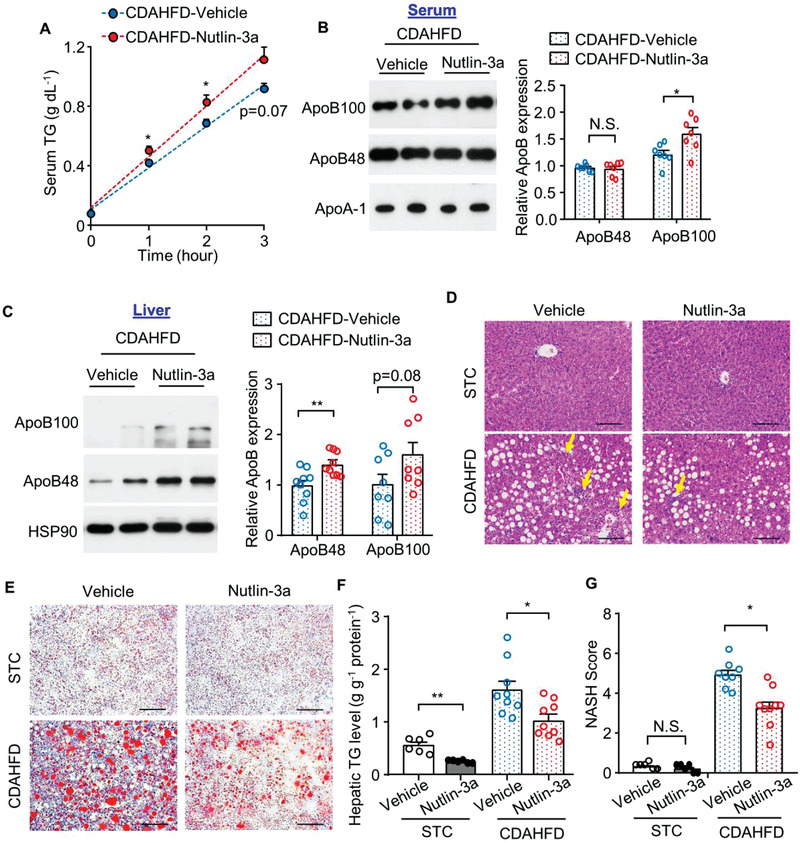
Figure 7.

Treatment with MDM2 inhibitor increases TG‐VLDL secretion and alleviates CDAHFD‐induced steatohepatitis. C57BL/6J mice were fed CDAHFD diet for 2 weeks, followed by treatment with Nutlin‐3a or DMSO (as vehicle control) for 1 week (panel A,B) and 2 weeks (panel C–G). A,B) Serum was collected after tyloxapol injection for 3 h. Circulating levels of A) TG and B) ApoB. The bar chart in panel B) is the relative ApoB100 and ApoB48 expression normalized with ApoA‐1 (n = 7). C) Immunoblotting analysis of ApoB100 and ApoB48 in the liver tissues. The bar chart is densitometric quantification of ApoB proteins normalized with HSP90 (n = 8–9). D) Representative H&E staining and E) Oil‐red O staining of liver sections. Scale bar: 100 µm. Yellow arrows indicate immune cell clusters. F) Hepatic TG contents normalized with protein concentration (n = 6–9). G) NASH score (n = 6–9). All data are presented as mean ± SEM. *p < 0.05 and **p < 0.01. (Welch's t‐test for STC in panel F); two‐tailed independent Student's t‐test for the remaining data). Not significant (N.S.).
