
Figure 5.
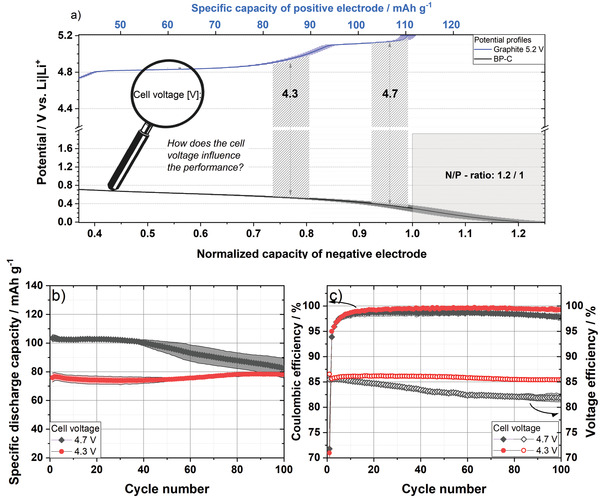
Electrochemical performance of graphite || BP‐C cells in constant current cycling charge/discharge experiments (two‐electrode configuration, full‐cell setup). a) Scheme of matched full potential profiles of graphite and BP‐C from the third charging step (lithiation/anion intercalation) and the influence of different applied cell voltages with an error margin of 5% and a capacity deviation of 10% (transparent area). b) Specific discharge capacity and c) C Eff as well as voltage efficiency of graphite || BP‐C full‐cells operated between 2.0 V and different upper cutoff cell voltages (4.3 or 4.7 V) at 50 mA g–1 with 3.4 m LiTFSI in DMC as electrolyte. Specific capacities and currents are related to the mass of the positive electrode.