
Figure 1.
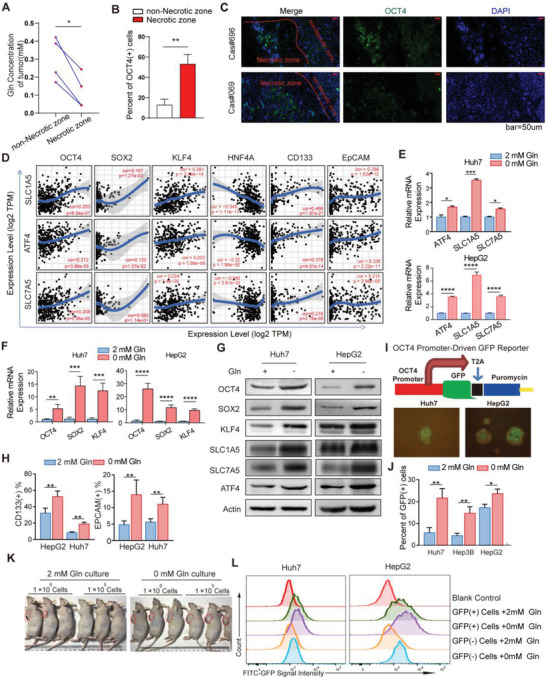
Glutamine starvation promotes stemness of liver cancer cells A) Quantification of glutamine concentration in the core zones with more necrotic tissue areas and in the periphery zones with no necrotic tissue areas of fresh tumors from HCC patients (n = 4). Gln, glutamine. B) The proportion of OCT4 positive cells detected by flow cytometry (FC) in living cells from the core zones with more necrotic tissue areas and the periphery zones with no necrotic tissue areas of fresh tumors from HCC patients (n = 3). C) Representative immunohistochemistry (IHC) and immunofluorescence (IF) images of OCT4 positive cells in nutrient limited tumors from HCC patients. Scale bars, 25 µm. D) The correlation between ATF4, SLC1A5 or SLC7A5 and OCT4, SOX2, KLF4, CD133, and EpCAM expression in liver hepatocellular carcinoma (LIHC) data from The Cancer Genome Atlas (TCGA) cohort. Spearman's correlation was used to assess the relationship between genes. E,F) The mRNA relative expression of ATF4, SLC1A5, SLC7A5, OCT4, SOX2, and KLF4 in Huh7 and HepG2 cell lines after glutamine starvation for 48 h, in contrast to normal culture medium (n = 4). G) The protein expression of OCT4, SOX2, KLF4, ATF4, SLC1A5, and SLC7A5 in Huh7 and HepG2 cell lines after glutamine starvation for 48 h, in contrast to normal culture medium. H) Percent of CD133 (+) cells and EpCAM (+) cells detected by FC in Huh7 and HepG2 cells cultured in medium with or without glutamine for 48 h (n = 6). I) Structural diagram of OCT4 promoter‐driven GFP plasmid based on the lentiviral vector; representative photographs showing sphere formation capacity of Huh7 and HepG2 cell lines on day 12; representative images of OCT4‐GFP (+) cells in Huh7 and HepG2 cell lines cultured in medium with or without glutamine for 48 h. J) Percent of GFP (+) cells detected by FC in various cancer cell lines cultured in medium with or without glutamine for 48 h (n = 3). (K) Huh7 cells were cultured in medium with (2 × 10⁻³ m) or without glutamine for 48 h and then inoculated different doses (1 × 10⁶ or 1 × 10⁵ cells) in nude mice. Representative photographs show the tumor volume difference. (L) OCT4‐GFP (+) and OCT4‐GFP (−) cells were selected by FC and cultured with or without glutamine for 48 h. The average fluorescence intensity of GFP were detected by FITC channel of FC (n = 3). All data are shown in A,B, E,F, J) as the mean values ± SD, p values are based on Student's t test. ****p < 0.0001, ***p < 0.001, **p < 0.01, *p < 0.05.