
Figure 2.
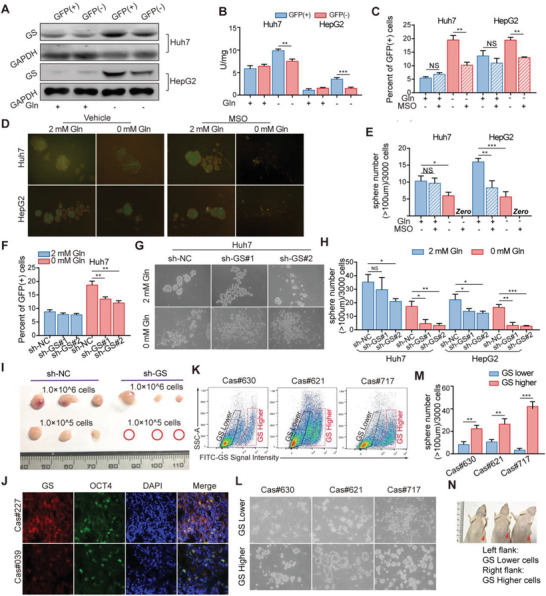
A,B) Liver cancer cells upregulate glutamine synthetase expression to sustain stem‐like characteristics upon glutamine starvation A) GS expression and B) activity were determined in GFP (+) or GFP (−) cells which were selected by fluorescence‐activated cell sorting (FACS) from Huh7 and HepG2 cells cultured in medium with or without glutamine for 12 h. C) Percent of OCT4‐GFP (+) cells detected by FC in Huh7 and HepG2 cells pretreated with MSO (1 × 10⁻³ m) and cultured in medium with or without glutamine for 48 h (n = 3). D) Representative images and E) quantification of the sphere numbers in Huh7 and HepG2 cells with treatment of MSO (1 × 10⁻³ m) in medium with or without glutamine (n = 6). F) Percent of GFP (+) cells detected by FC in Huh7 cells expressing sh‐NC or sh‐GS cultured in medium with or without glutamine for 48 h (n = 3). G) Representative images and H) quantification of the sphere numbers of Huh7 and HepG2 cells expressing sh‐Con or sh‐GS cultured in medium with or without glutamine for 12 days (n = 6). I) Representative images of xenograft tumors injected with 1.0 × 10⁶ and 1.0 × 10⁵ Huh7 cells expressing sh‐NC and sh‐GS in NSG mice (n = 3). The tumor‐harboring mice were sacrificed on day 14 after the first measurement. J) Representative images of GS and OCT4 expression in human liver cancer samples by immunofluorescence (IF) assay. Scale bars, 10 µm. K) Representative FC plots showing FITC‐GS staining levels in primary patient liver cancer cells. L) Representative images and M) quantification of the sphere numbers in GS high and low expression cells selected by FC from primary patient liver cancer cells treated with Gln‐free medium without serum for 12 days. N) Representative images of PDX tumors formed by cells with GS lower (Left flank) and higher (Right flank) expression which were selected by FC from primary patient liver cancer cells. All data are shown as the mean values ± SD, p values are based on Student's t test. ***p < 0.001, **p < 0.01, *p < 0.05; NS, nonsignificant.