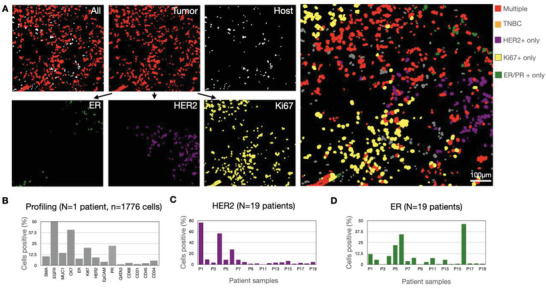
Figure 8.

Analysis of cellular biomarkers in patient cohort. A) Synthetic images derived from FFPE tissue section. Note the exclusive separation of tumor and host cells and the ability to analyze individual cells for markers. Top right: Mosaic of individual cancer cells that express multiple markers (red; positive for HER2, ER, PR, and/or Ki67), Ki67 only (yellow), HER2 only (purple), ER/PR only (green), or no HER2/ER/PR/Ki67 (orange). B) Summary of biomarker expression in one patient sample. A total of 14 markers were analyzed. C) Summary of HER2 expression across patient cohort (n = 19 patients). D) Summary of ER expression across patient cohort (n = 19 patients).
