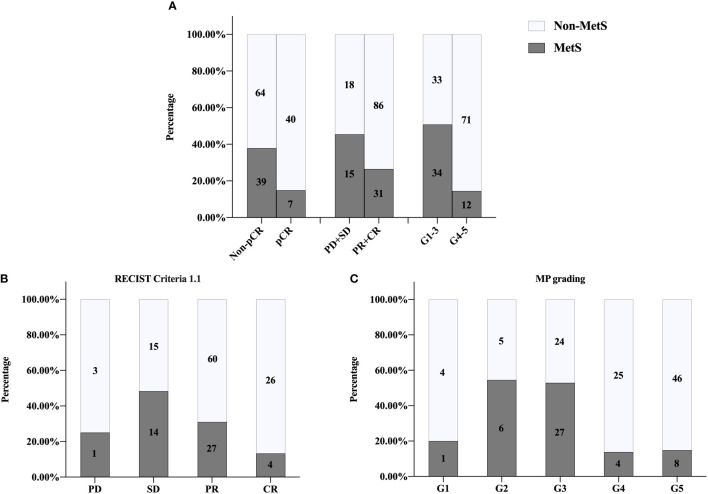
Figure 2.
Univariate analysis of relationship between MetS and NACT response. (A) pCR, P = 0.003; clinical responses, P = 0.033; pathologic responses, P <0.001. (B) RECIST1.1 criteria P = 0.004. (C) MP grading P < 0.001. MetS, metabolic syndrome; pCR, pathologic complete response; PD, progressive disease; SD, stable lesions; PR, partial response; CR, complete response; MP, Miller-Payne; RECIST, response evaluation criteria in solid tumors.

