Figure 1.
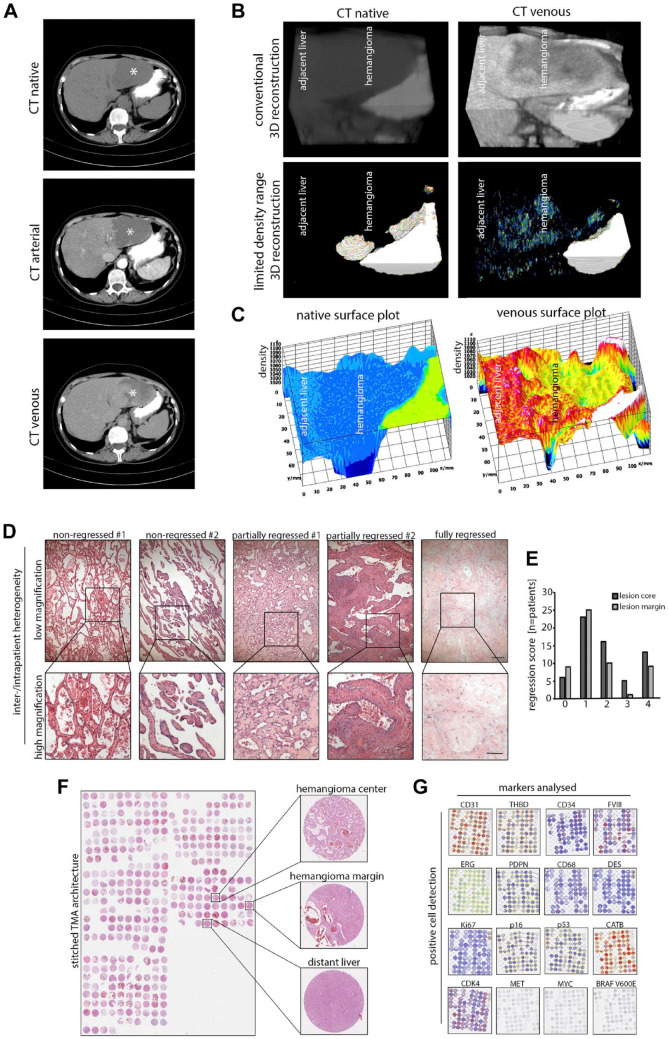
Functional and morphological heterogeneity in HHs and study design. (A) CT scan of a patient with a large hemangioma located in the left liver lobe (asterisk). Specified imaging phases show an inhomogeneous uptake of contrast agent in the lesion. (B) Three-dimensional reconstruction of the hemangioma margin of the same patient. Limited density range visualization removes liver-specific signal and visualizes inhomogeneous uptake of contrast agent in HH. (C) Native and venous phase density surface plots of the same patient. Inhomogeneous contrast agent uptake in the lesion can be observed. (D) H&E images of five HHs with different intralesional morphology as displayed by vascular morphology and degree of tissue regression. Scale bar: 200 µm (low) and 100 µm (high). (E) Distribution of the regression score in HH centers and marginal zones (0 = “none,” 1 = “slight,” 2 = “intermediate,” 3 = “strong,” 4 = “very strong”; n=63). (F) Stitched H&E overview of the TMA consisting of five slides in total covering 98 HH, 80 HH margins, and 78 distant liver tissues and 339 cores in total. (G) Low magnification overview of a tissue microarray section after positive cell detection of the respective marker panel used in this study (see Table 1). MET, MYC, and BRAF V600E were not digitally scored due to negative staining results. Abbreviations: HH, hepatic hemangioma; CT, computed tomography; H&E, hematoxylin and eosin; TMA, tissue microarray.

