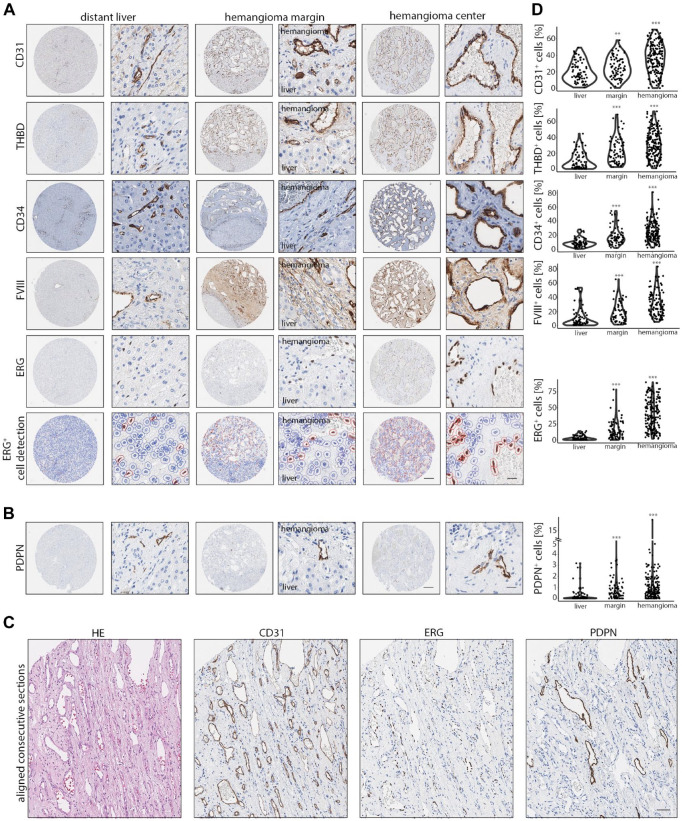
Figure 2.
A CEC marker panel reveals endothelial heterogeneity in HHs. (A) Low and high magnification of CD31, THBD, CD34, FVIII, and ERG in liver, hemangioma margin, and hemangioma center. Last row: Overlay of ERG-positive cell detection demonstrates a highly accurate cell classification. Scale bar: 250 µm (low) and 20 µm (high). (B) Low and high magnification of PDPN expression in liver, hemangioma margin, and hemangioma center. In liver, only a minor fraction of portal vessels stain positive for PDPN, whereas a higher abundance of PDPN+ ECs in hemangioma margins and centers can be detected. Scale bar: 250 µm (low) and 20 µm (high). (C) Aligned consecutive H&E and immunohistochemical sections of CD31, ERG, and PDPN of HH. The presence of PDPN+ lyECs next to CD31+ and ERG+ cells demonstrates intralesional vascular heterogeneity. Scale bar: 100 µm. (D) Percentual distribution of CD31+, THBD+, CD34+, FVIII+, ERG+, and PDPN+ cells in liver, hemangioma margin (margin), and hemangioma center (hemangioma). Comparison of liver tissue vs tissue area of interest by Wilcoxon rank-sum test (**p<0.01, ***p<0.001). Abbreviations: CEC, continuous endothelial cell; HH, Hepatic hemangioma; FVIII, factor FVIII related antigen; ERG, ETS transcription factor ERG; PDPN, podoplanin; EC, endothelial cell; H&E, haematoxylin eosin; lyEC, lymphatic endothelial cell; THBD, thrombomodulin.

