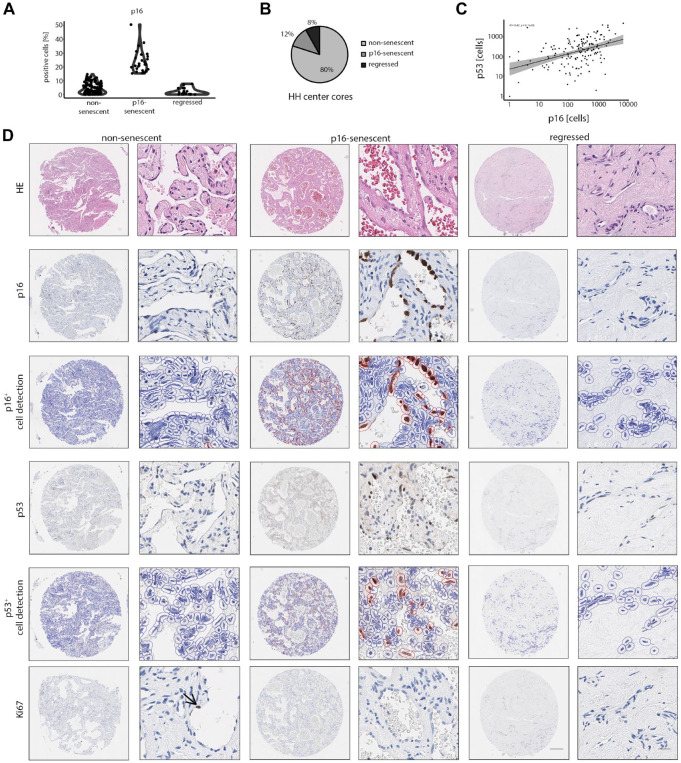
Figure 3.
Defined spatial- and core-specific stages of non-senescent, p16-senescent, and regressed HHs. (A) Percentual distribution of p16+ cells in non-senescent, p16-senescent, and regressed hemangiomas after digital senescence classification. Cutoff for p16-positivity was set to 10%. (B) Percentual distribution of non-senescent, p16-senescent, and regressed hemangiomas after HH classification. (C) Correlation analysis between p16+ and p53+ cell numbers in HH cores (Spearman correlation analysis). (D) Low and high magnification of H&E, p16, p16+ cell detection, p53, p53+ cell detection, and Ki67 in non-senescent, p16-senescent, and regressed hemangiomas. Arrow indicates a Ki67+ EC in a non-senescent HH. Scale bar: 250 µm (low) and 20 µm (high). Abbreviations: HH, hepatic hemangioma; H&E, haematoxylin eosin; EC, endothelial cell.

