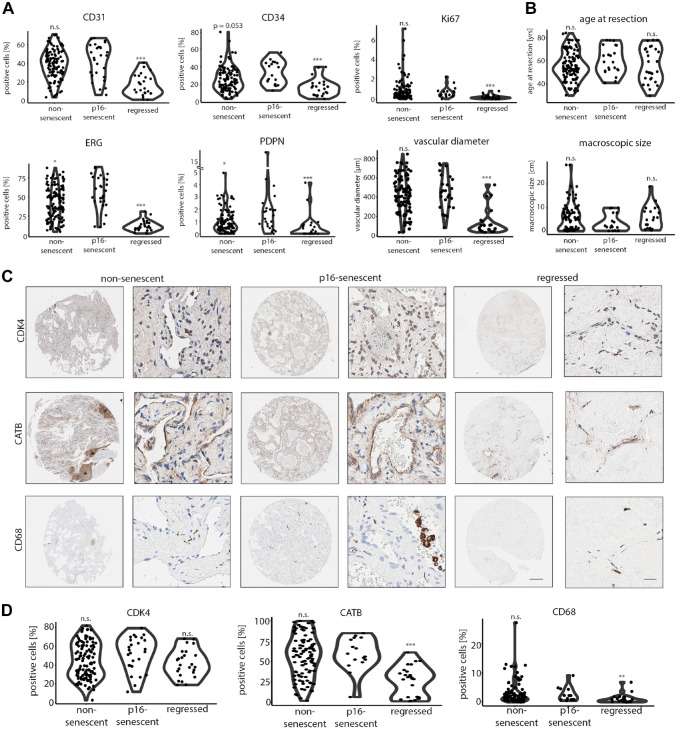
Figure 4.
Unique cell composition in non-senescent, p16-senescent, and regressed HHs. (A) Percentual distribution of CD31+, CD34+, ERG+, PDPN+, and Ki67+ cells and average vascular diameters in non-senescent, p16-senescent, and regressed hemangiomas after HH classification. Comparison of p16-senescent hemangiomas vs subgroup of interest by Wilcoxon rank-sum test (*p<0.05, ***p<0.001). (B) Age at resection and HH macroscopic size in non-senescent, p16-senescent, and regressed hemangiomas. Comparison of p16-senescent hemangiomas vs subgroup of interest by Wilcoxon rank-sum test (n.s.). (C) Low and high magnification of CDK4, CATB, and CD68 in non-senescent, p16-senescent, and regressed hemangiomas. Scale bar: 250 µm (low) and 20 µm (high). Asterisk (*) demarcates insulas of CATB-positive retained hepatocytes in a non-senescent HH. (D) Percentual distribution of CDK4+, CATB+, and CD68+ cells in non-senescent, p16-senescent, and regressed hemangiomas after HH classification. Comparison of p16-senescent hemangiomas vs subgroup of interest by Wilcoxon rank-sum test (**p<0.01, ***p<0.001). Abbreviations: HH, hepatic hemangioma; CDK4, cyclin-dependent kinase 4; CATB, catenin beta 1; n.s., not significant.

