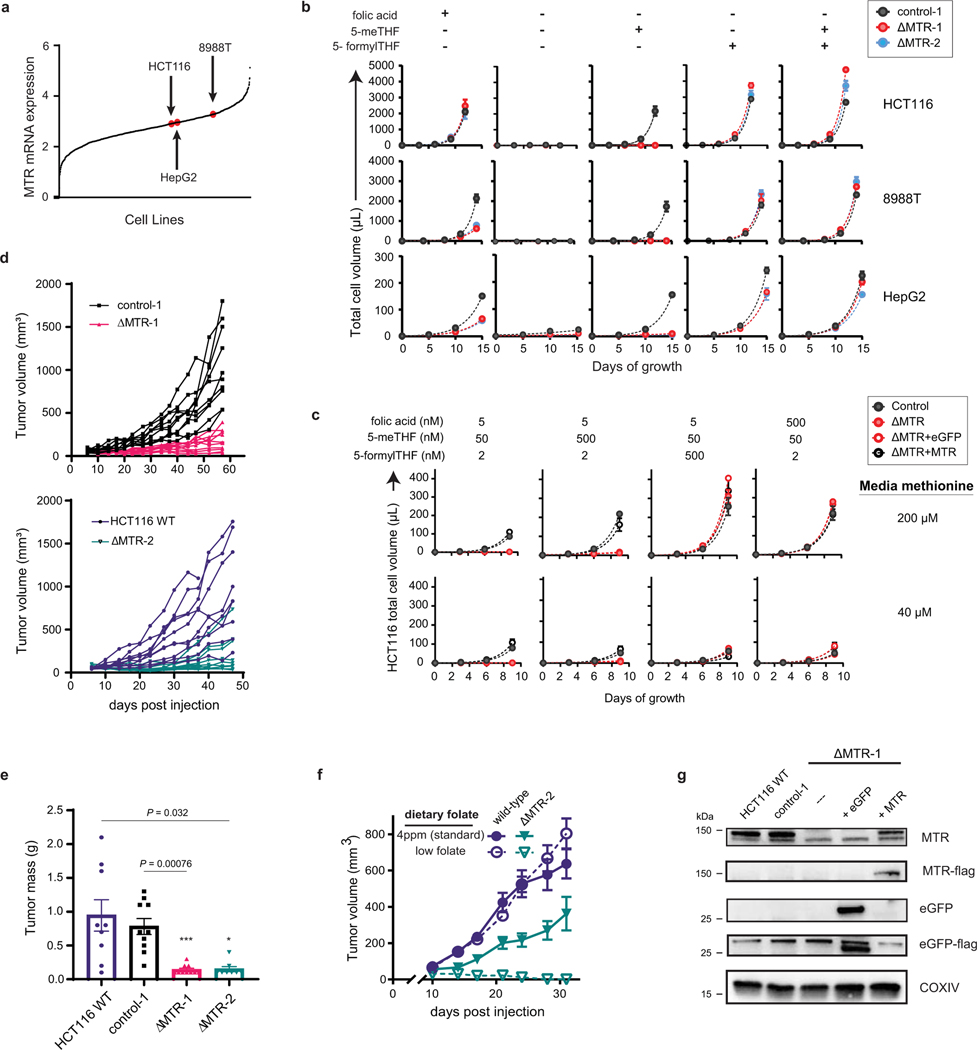
Extended Data Fig. 2. MTR is important for cell growth in physiological folates.
(A) Expression of MTR in the HCT116, 8988T, and HepG2 cell lines as reported in the Cancer Cell Line Encyclopedia[63]. (B) Cell growth curves in the media containing indicated folate sources (mean ± SD, n = 2). (C) Cell growth curves in media containing indicated folate and methionine concentrations (mean ± SD, n = 3). (D) Individual tumor volumes for HCT116 xenografts in female CD-1 nude mice (n = 10 mice). (E) Terminal tumor mass of HCT116 xenografts in female CD-1 nude mice (mean ± SEM, n = 10 mice). P values were determined by a two-sided paired Student’s t-test comparing ΔMTR-1 to wild-type, and ΔMTR-2 to CRISPR control (control-1). (F) Growth of subcutaneous HCT116 xenografts in male CD-1 nude mice on a standard folate (4ppm) or low folate diet (mean ± SEM, n = 10 mice). (G) Western blot analysis of MTR and eGFP in HCT116 wild-type (WT), CRISPR control-1 or ΔMTR-1 which was also engineered to express a vector containing either eGFP or MTR cDNA. Loading control (COXIV) was analyzed on a separate gel from parallel experiments. Results are representative of 2 independent biological replicates with similar results.

