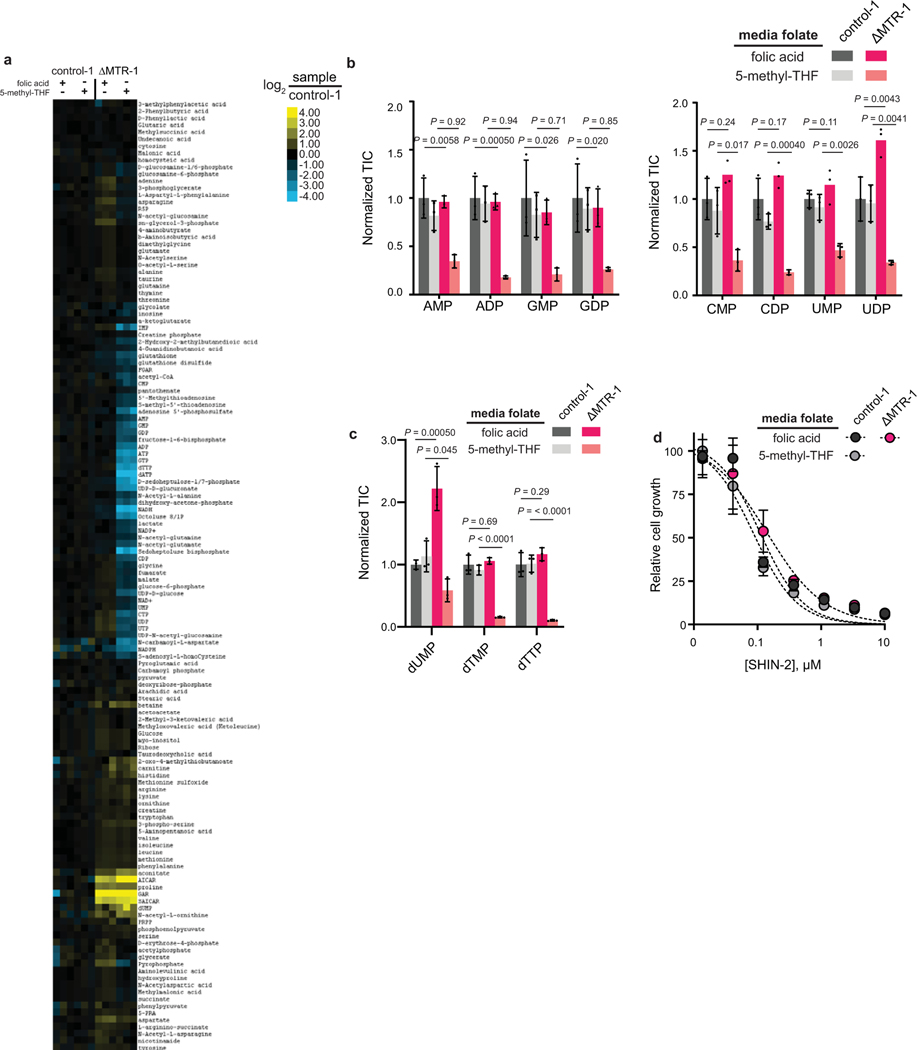
Extended Data Fig. 3. Loss of MTR disrupts nucleotide synthesis.
(A) Water-soluble metabolite levels from HCT116 control and MTR knockout cells cultured in indicated media conditions. Each box reflects one independent biological measurement, normalized to the average of control cells cultured in folic acid. (B) Relative nucleotide mono- and diphosphate abundances in HCT116 control and MTR knockout cells in indicated media. Intensities are normalized to the average of control-1 cells in folic acid (mean ± SD, n = 3). (C) Relative thymidylate species abundances in HCT116 control and knockout cells in indicated media. Intensities are normalized to the average of control-1 cells in folic acid (mean ± SD, n = 3). TIC = total ion count. (D) Cell growth dose response curves for HCT116 WT and MTR knockout cells treated with SHMT1/2 inhibitor SHIN2 under different folate conditions (mean ± SD, n = 5). For (B) and (C), P values were determined by a one-way ANOVA comparing control to MTR knockout in the same medium followed by Dunnett’s post hoc analysis.

