
Figure 3:
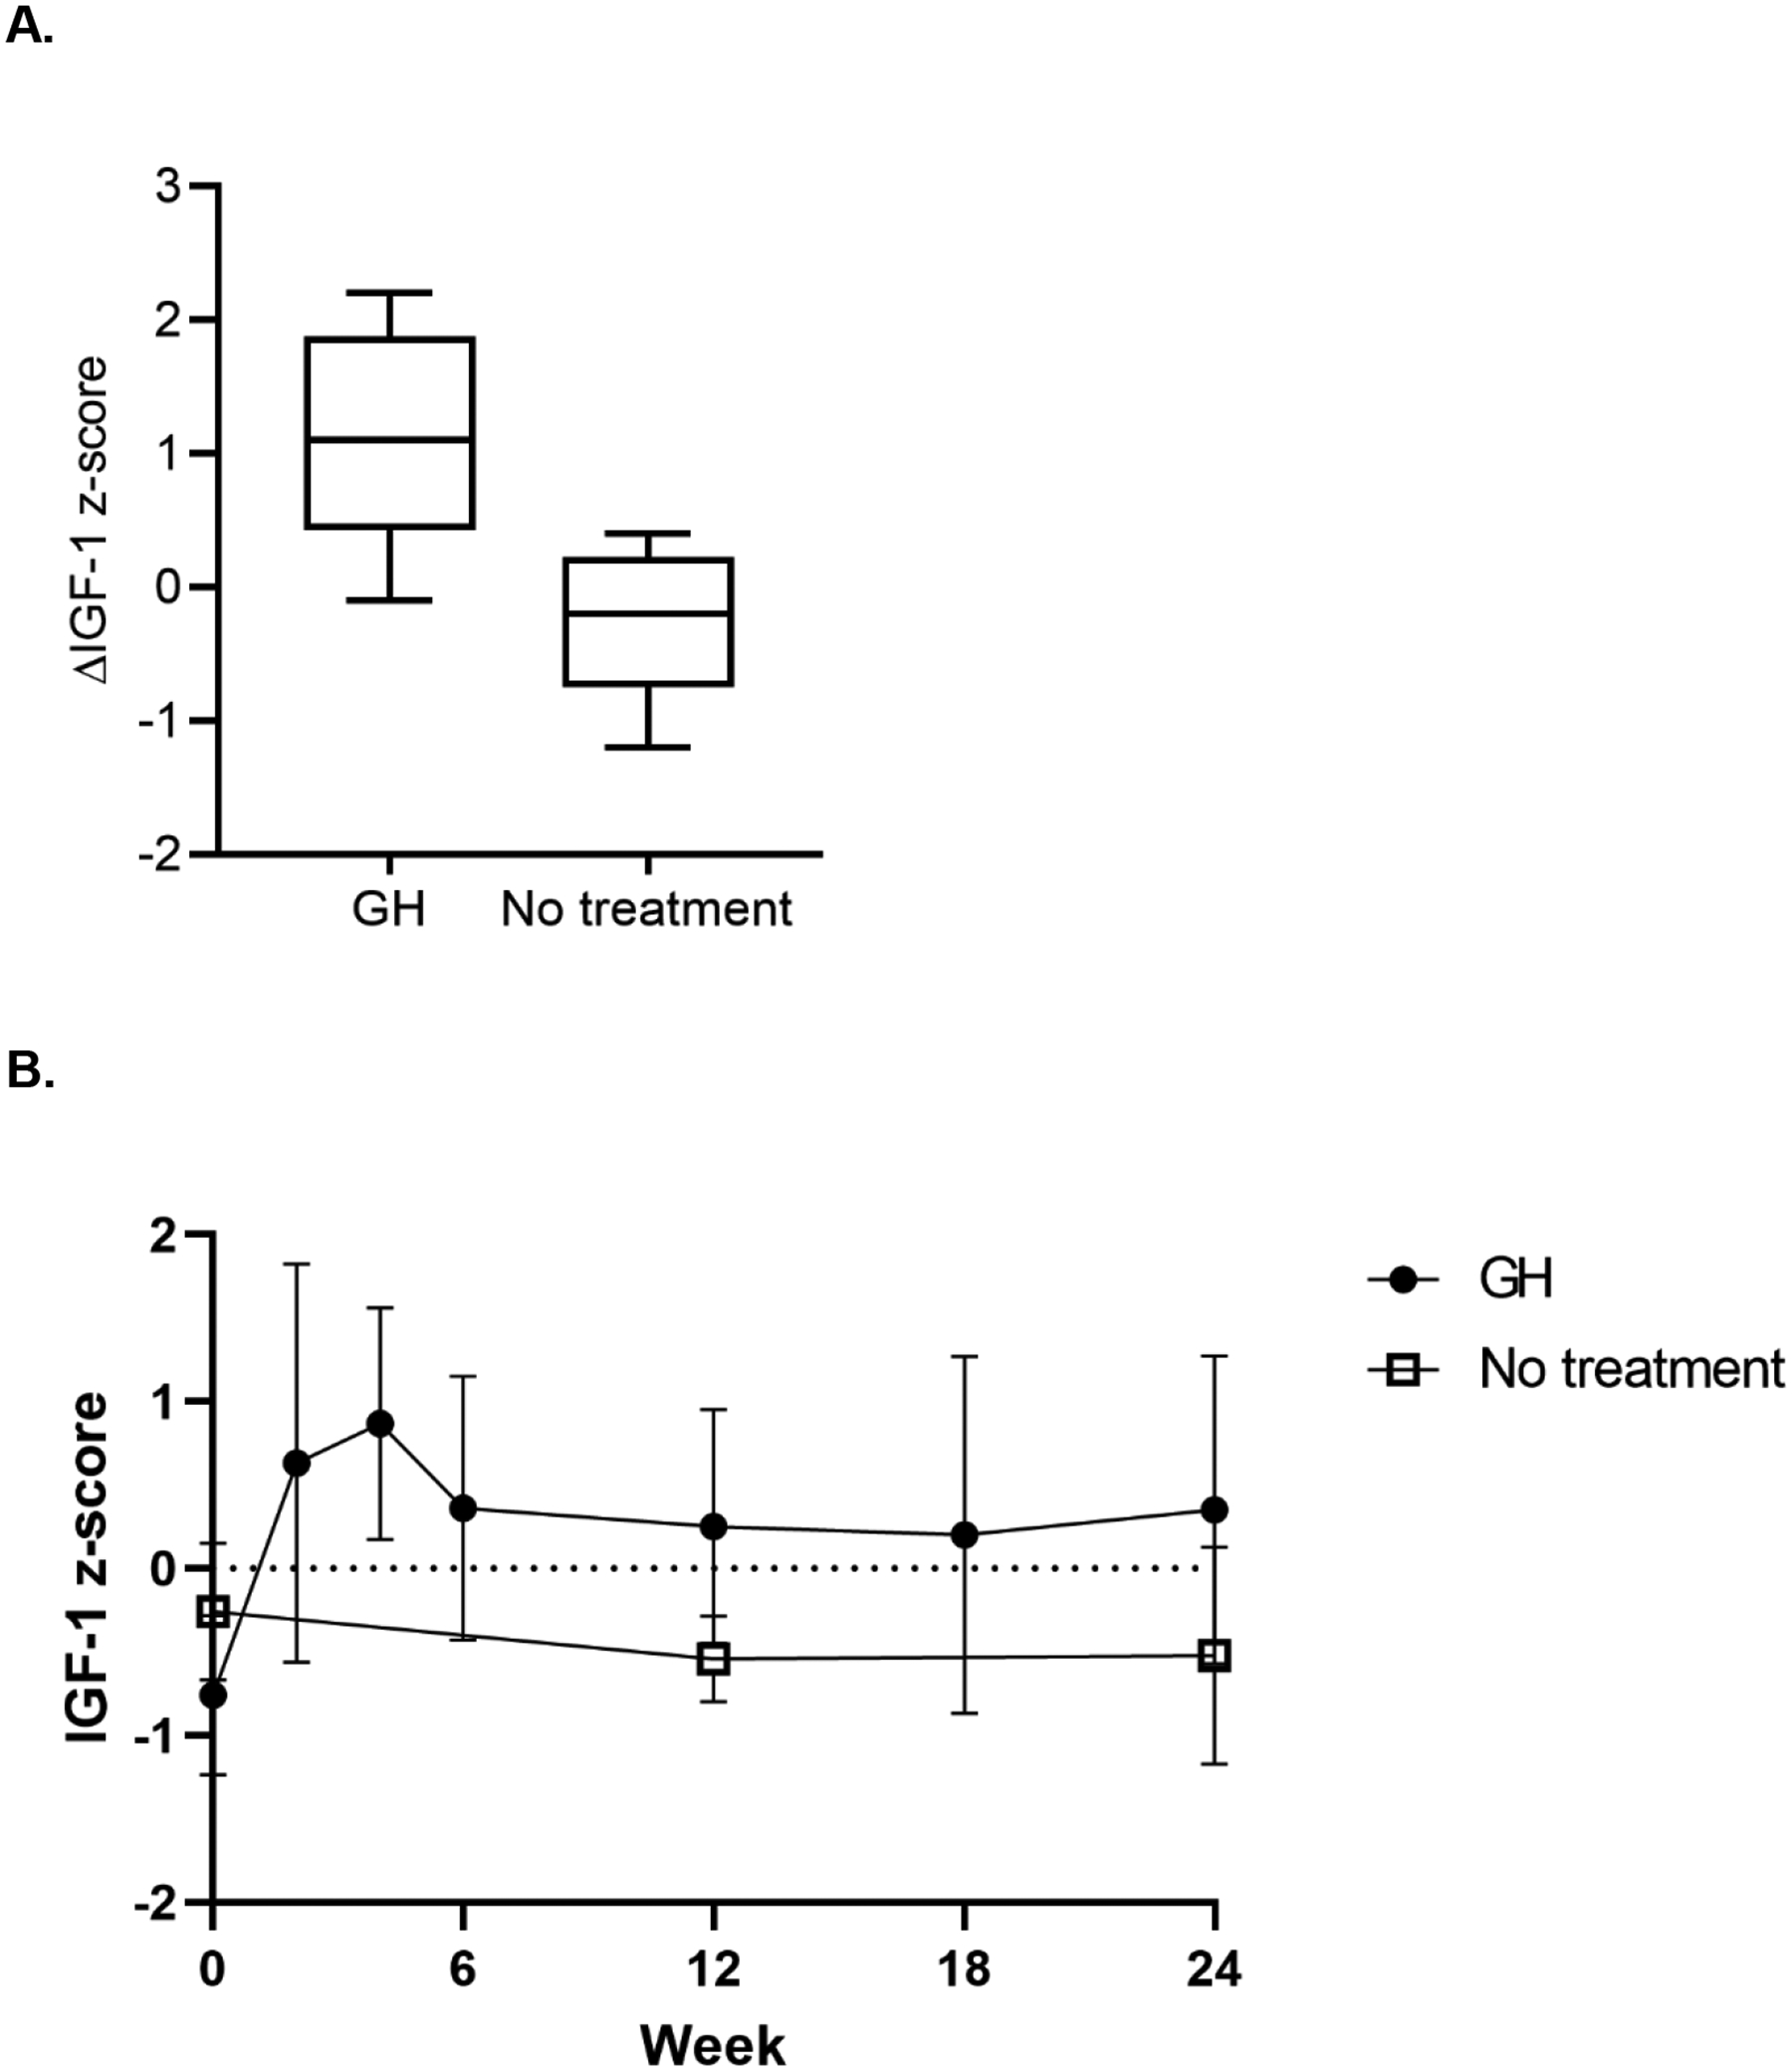
(A) Box-plot representation of the change in IGF-1 z-score, with the middle bar representing the median, the boxes representing interquartile range, and the whiskers representing 95th percentile. (B) IGF-1 z-score (mean with standard deviation) at each timepoint in each treatment group.